
Page 426 - Provincial Treasury Estimates.pdf
P. 426
Department: Cooperative Governance and Traditional Affairs
9. 9. Other programme information
9.1. Personnel numbers and costs
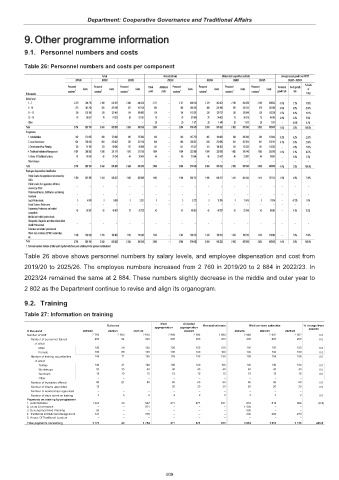
Table 26: Personnel numbers and costs per component
Actual Revised estimate Medium-term expenditure estimate Average annual growth over MTEF
2019/20 2020/21 2021/22 2022/23 2023/24 2024/25 2025/26 2022/23 - 2025/26
% Costs
Personnel Costs Personnel Costs Personnel Costs Filled Additional Personnel Costs Personnel Costs Personnel Costs Personnel Costs Personnel Costs growth of
numbers 1 numbers 1 numbers 1 posts posts numbers 1 numbers 1 numbers 1 numbers 1 growth rate rate
R thousands Total
Salary level
1 – 7 2 270 300 718 2 180 412 587 2 004 446 228 2 171 – 2 171 469 014 2 174 462 463 2 109 494 550 2 109 498 833 -1.0% 2.1% 51.9%
8 – 10 273 342 740 265 225 916 437 197 136 483 – 483 208 435 486 226 160 470 242 222 470 253 956 -0.9% 6.8% 25.0%
11 – 12 139 125 106 120 122 481 114 109 993 134 – 134 113 031 128 120 777 128 120 640 128 136 339 -1.5% 6.4% 13.1%
13 – 16 78 59 627 78 74 222 69 83 181 76 – 76 87 994 76 94 482 75 96 576 75 94 345 -0.4% 2.4% 9.9%
Other – – – – – – 20 – 20 1 171 20 1 440 20 1 573 20 1 571 – 10.3% 0.2%
Total 2 760 828 190 2 643 835 205 2 624 836 539 2 884 – 2 884 879 645 2 884 905 323 2 802 955 560 2 802 985 045 -1.0% 3.8% 100.0%
Programme
1. Administration 342 172 095 288 170 832 302 175 883 365 – 365 187 759 365 194 983 363 206 383 363 212 464 -0.2% 4.2% 21.5%
2. Local Governance 634 236 458 604 233 052 581 237 138 648 – 648 238 857 648 252 690 647 267 814 647 276 741 -0.1% 5.0% 27.8%
3. Development And Planning 130 91 158 123 89 686 127 89 888 141 – 141 97 527 141 104 903 141 112 332 141 115 363 – 5.8% 11.5%
4. Traditional Institutional Management 1 607 309 936 1 586 321 511 1 570 313 156 1 684 – 1 684 333 898 1 684 330 200 1 605 345 140 1 605 355 816 -1.6% 2.1% 36.7%
5. House Of Traditional Leaders 47 18 543 42 20 124 44 20 474 46 – 46 21 604 46 22 547 46 23 891 46 24 661 – 4.5% 2.5%
Direct charges – – – – – – – – – – – – – – – – – – –
Total 2 760 828 190 2 643 835 205 2 624 836 539 2 884 – 2 884 879 645 2 884 905 323 2 802 955 560 2 802 985 045 -1.0% 3.8% 100.0%
Employee dispensation classification
Public Service Act appointees not covered by 1 369 607 395 1 343 588 037 1 456 620 069 1 495 – 1 495 628 317 1 495 648 127 1 413 692 383 1 413 707 573 -1.9% 4.0% 71.9%
OSDs
Public Service Act appointees still to be – – – – – – – – – – – – – – – – – – –
covered by OSDs
Professional Nurses, Staff Nurses and Nursing – – – – – – – – – – – – – – – – – – –
Assistants
Legal Professionals 3 4 699 3 9 699 3 3 231 3 – 3 3 722 3 11 286 3 11 475 3 11 874 – 47.2% 1.0%
Social Services Professions – – – – – – – – – – – – – – – – – – –
Engineering Professions and related 42 30 507 42 40 507 37 42 735 42 – 42 48 693 42 46 757 42 52 549 42 54 903 – 4.1% 5.5%
occupations
Medical and related professionals – – – – – – – – – – – – – – – – – – –
Therapeutic, Diagnostic and other related Allied – – – – – – – – – – – – – – – – – – –
Health Professionals
Educators and related professionals – – – – – – – – – – – – – – – – – – –
Others such as interns, EPWP, learnerships, 1 346 185 589 1 255 196 962 1 128 170 504 1 344 – 1 344 198 913 1 344 199 153 1 344 199 153 1 344 210 695 – 1.9% 21.6%
etc
Total 2 760 828 190 2 643 835 205 2 624 836 539 2 884 – 2 884 879 645 2 884 905 323 2 802 955 560 2 802 985 045 -1.0% 3.8% 100.0%
1. Personnel numbers includes all filled posts together with those posts additional to the approved establishment
Table 26 above shows personnel numbers by salary levels, and employee dispensation and cost from
2019/20 to 2025/26. The employee numbers increased from 2 760 in 2019/20 to 2 884 in 2022/23. In
2023/24 remained the same at 2 884. These numbers slightly decrease in the middle and outer year to
2 802 as the Department continue to revise and align its organogram.
9.2. Training
Table 27: Information on training
Main Adjusted
Outcome Revised estimate Medium-term estimates % change from
appropriation appropriation
R thousand 2019/20 2020/21 2021/22 2022/23 2023/24 2024/25 2025/26 2022/23
Number of staff 2 760 2 643 2 624 2 884 2 884 2 884 2 884 2 802 2 802 0.0
Number of personnel trained 200 94 200 200 200 200 200 200 200 0.0
of which
Male 100 28 100 100 100 100 100 100 100 0.0
Female 100 66 100 100 100 100 100 100 100 0.0
Number of training opportunities 145 71 155 155 155 155 155 155 155 0.0
of which
Tertiary 100 21 100 100 100 100 100 100 100 0.0
Workshops 30 35 40 40 40 40 40 40 40 0.0
Seminars 15 15 15 15 15 15 15 15 15 0.0
Other – – – – – – – – –
Number of bursaries offered 60 21 60 60 60 60 60 60 60 0.0
Number of interns appointed 12 – – 20 20 20 20 20 20 0.0
Number of learnerships appointed – – – – – – – – –
Number of days spent on training 2 5 2 2 2 2 2 2 2 0.0
Payments on training by programme
1. Administration 1 002 20 567 871 871 871 812 813 866 (6.8)
2. Local Governance – – 871 – – – 1 500 – –
3. Development And Planning 30 – – – – – 500 – –
4. Traditional Institutional Management 141 – 316 – – – 200 200 270
5. House Of Traditional Leaders – – – – – – – – –
Total payments on training 1 173 20 1 754 871 871 871 3 012 1 013 1 136 245.8
409