
Page 568 - Provincial Treasury Estimates.pdf
P. 568
Department: of Transport
8.5.1 Service Delivery Measures
Table 28: Selected service delivery measures for Programme 5: Community Based Programme
Estimated
performance Medium-term estimates
Programme performance measures 2022/23 2023/24 2024/25 2025/26
Number of interventions to reduce road fatalities 2 268 2 614 2 490 2 490
Number of work opportunities created through EPWP projects 33 965 31 118 32 365 32 365
Number of beneficiary empowerment Interventions 6 6 4 4
Number of work opportunities created 35 017 35 795 38 028 38 028
Number of full time equivalents (FTE) created 15 225 14 491 14 491 14 491
Number of youth employed (18-35) 19 259 19 687 20 915 20 915
Number of women employed 21 010 21 477 22 477 22 477
Number of persons with disabilites 700 716 716 716
The programme performance is measured by the number of work opportunities created in the
transportation sector.
9. 9. Other Programme information
9.1 Personnel numbers and costs by programme
Table 30: Personnel numbers and costs by component
Actual Revised estimate Medium-term expenditure estimate Average annual growth over MTEF
2019/20 2020/21 2021/22 2022/23 2023/24 2024/25 2025/26 2022/23 - 2025/26
% Costs
Personnel Costs Personnel Costs Personnel Costs Filled Additional Personnel Costs Personnel Costs Personnel Costs Personnel Costs Personnel Costs growth of
numbers 1 numbers 1 numbers 1 posts posts numbers 1 numbers 1 numbers 1 numbers 1 growth rate rate
R thousands Total
Salary level
1 – 7 1 898 260 789 1 818 497 370 2 095 264 619 1 441 252 1 693 600 435 1 967 746 484 1 886 714 602 1 886 745 507 3.7% 7.5% 57.0%
8 – 10 480 319 000 527 271 764 452 315 947 389 68 457 264 279 473 240 735 467 286 793 467 299 640 0.7% 4.3% 23.5%
11 – 12 134 99 003 134 141 852 116 100 296 93 35 128 134 016 120 124 839 132 150 605 132 160 309 1.0% 6.2% 12.3%
13 – 16 43 279 200 43 68 135 42 266 354 37 3 40 48 177 27 56 035 30 52 065 30 54 397 -9.1% 4.1% 4.3%
Other 500 40 717 100 15 094 146 50 837 109 11 120 24 342 158 23 689 260 38 204 260 39 915 29.4% 17.9% 2.8%
Total 3 055 998 709 2 622 994 216 2 851 998 053 2 069 369 2 438 1 071 248 2 745 1 191 783 2 775 1 242 269 2 775 1 299 768 4.4% 6.7% 100.0%
Programme
1. Administration 553 260 789 664 260 902 636 264 619 444 105 549 281 585 636 312 298 690 349 310 690 369 913 7.9% 9.5% 27.7%
2. Transport Infrastructure 1 076 319 000 1 025 307 460 1 090 315 949 794 154 948 330 486 1 053 356 062 993 370 507 993 387 106 1.6% 5.4% 30.1%
3. Transport Operations 218 105 132 225 101 120 300 105 318 176 48 224 110 624 267 136 248 233 134 058 233 136 956 1.3% 7.4% 10.6%
4. Transport Regulation 644 273 071 643 277 275 715 261 331 632 – 632 289 113 675 319 683 653 309 330 653 323 188 1.1% 3.8% 25.5%
5. Community Based Programmes 564 40 717 65 47 459 110 50 836 23 62 85 59 441 114 67 492 206 79 064 206 82 605 34.3% 11.6% 6.1%
Direct charges – – – – – – – – – – – – – – – – – – –
Total 3 055 998 709 2 622 994 216 2 851 998 053 2 069 369 2 438 1 071 248 2 745 1 191 783 2 775 1 242 269 2 775 1 299 768 4.4% 6.7% 100.0%
Employee dispensation classification
Public Service Act appointees not covered by 2 859 842 367 1 634 886 403 1 599 901 041 1 137 369 1 506 1 034 436 1 857 1 153 354 1 843 1 202 114 1 843 1 257 815 7.0% 6.7% 96.7%
OSDs
Public Service Act appointees still to be – – – – – – – – – – – – – – – – – – –
covered by OSDs
Professional Nurses, Staff Nurses and Nursing – – – – – – – – – – – – – – – – – – –
Assistants
Legal Professionals 3 748 3 748 51 789 3 – 3 826 3 862 3 901 3 941 – 4.4% 0.1%
Social Services Professions 1 375 1 396 1 418 1 – 1 438 1 457 1 478 1 499 – 4.4% 0.0%
Engineering Professions and related 192 155 219 384 84 949 538 72 996 384 – 384 11 673 384 12 184 384 12 731 384 13 301 – 4.4% 1.0%
occupations
Medical and related professionals – – – – – – – – – – – – – – – – – – –
Therapeutic, Diagnostic and other related Allied – – – – – – – – – – – – – – – – – – –
Health Professionals
Educators and related professionals – – – – – – – – – – – – – – – – – – –
Others such as interns, EPWP, learnerships, – – 600 21 720 662 22 809 544 – 544 23 875 500 24 926 544 26 045 544 27 212 – 4.5% 2.1%
etc
Total 3 055 998 709 2 622 994 216 2 851 998 053 2 069 369 2 438 1 071 248 2 745 1 191 783 2 775 1 242 269 2 775 1 299 768 4.4% 6.7% 100.0%
1. Personnel numbers includes all filled posts together with those posts additional to the approved establishment
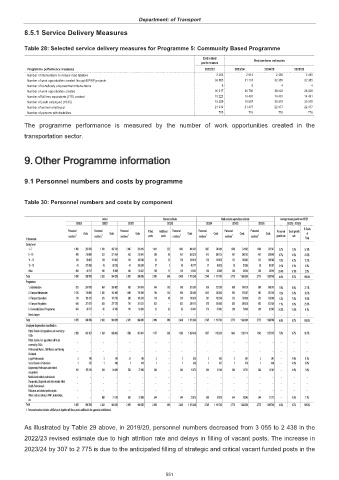
As illustrated by Table 29 above, in 2019/20, personnel numbers decreased from 3 055 to 2 438 in the
2022/23 revised estimate due to high attrition rate and delays in filling of vacant posts. The increase in
2023/24 by 307 to 2 775 is due to the anticipated filling of strategic and critical vacant funded posts in the
551