Page 357 - Provincial Treasury Estimates.pdf
P. 357

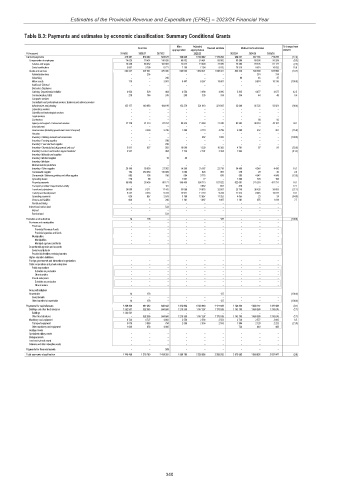
Estimates of the Provincial Revenue and Expenditure (EPRE) – 2023/24 Financial Year

           Table B.3: Payments and estimates by economic classification: Summary Conditional Grants

                                                                 Main   Adjusted                      % change from
                                                   Outcome                 Revised estimate  Medium-term estimates
                                                               appropriation  appropriation           2022/23
            R thousand                       2019/20  2020/21  2021/22  2022/23     2023/24  2024/25  2025/26
            Current payments                                376 257                  678 292                  581 574                  746 836               1 149 982               1 122 203                  928 027                  487 735                  716 278  (17.3)
             Compensation of employees                        74 026                    70 431                  110 635                    80 832                    81 461                    83 882                    83 599                    89 036                    91 209  (0.3)
              Salaries and wages                              70 329                    66 632                  103 864                    73 674                    74 303                    74 970                    73 280                    79 435                    81 177  (2.3)
              Social contributions             3 697  3 799  6 771  7 158  7 158  8 912                    10 319  9 601                    10 032  15.8
             Goods and services                             302 231                  607 861                  470 406                  666 004               1 068 521               1 038 321                  844 428                  398 699                  625 069  (18.7)
              Administrative fees                –    205     –     –     –      –     –     301   314

              Advertising                        –     –     246    –     –      –     90                           45  47
              Minor assets                      118                             –  3 001  8 447  8 367                    15 601  –  9 874                    10 316  (100.0)
              Audit cost: External               –     –      –     –     –      –     –      –     –
              Bursaries: Employees               –     –      –     –     –      –     –      –     –
              Catering: Departmental activities  4 934  529  464   4 554  3 690  4 095  5 835  4 477  4 677  42.5
              Communication (G&S)               279   146    245   240    335   334    336   44     46    0.6
              Computer services                  –     –      –     –     –      –     –      –     –
              Consultants and professional services: Business and advisory services  –  –  –  –  –  –  –  –  –
              Infrastructure and planning                   125 177                  140 988                  164 199                  152 279                  321 010                  321 847                    32 049                    45 535                    50 921  (90.0)
              Laboratory services                –     –      –     –     –      –     –      –       –
              Scientific and technological services  –  –     –     –     –      –     –      –       –
              Legal services                     –     –      –     –     –      –     –      –     –
              Contractors                        –     –      –     –     –      –     –     88     92
              Agency and support / outsourced services                     27 749                    21 313                    67 794                    69 343                    71 368                    71 346                    94 994  38 464                    40 187  33.1
              Entertainment                      –     –      –     –     –      –     –      –       –
              Fleet services (including government motor transport)  –  3 204  3 236  1 899  4 774  4 759  4 000  432  451  (15.9)
              Housing                            –     –      –     –     –      –     –      –     –
              Inventory: Clothing material and accessories  –  –  –  –    462  1 022   –      –     –    (100.0)
              Inventory: Farming supplies        –     –     788    –     –      –     –      –       –
              Inventory: Food and food supplies  –     –     296    –     –      –     –      –       –
              Inventory: Chemicals,fuel,oil,gas,wood and coal  5 811  627  582                    10 000  1 320                    10 382  4 781  87  91  (53.9)
              Inventory: Learner and teacher support material  2 521  –  464  1 724  2 701  3 304  1 942  –  –  (41.2)
              Inventory: Materials and supplies  –     –      –     –     –      –     –      –       –
              Inventory: Medical supplies        –     –     19     40    –      –     –      –       –
              Inventory: Medicine                –     –      –     –     –      –     –      –       –
              Medsas inventory interface         –     –      –     –     –      –     –      –     –
              Inventory: Other supplies                       29 149                    39 559  27 362                    14 300                    31 167                    22 718                    34 469  4 246  4 436  51.7
              Consumable supplies               754                  359 030  115 099  1 086  626  367  376  29  30  2.5
              Consumable: Stationery,printing and office supplies  863  195  790  564  3 275  676  585  4 642  4 849  (13.5)
              Operating leases                  229    86     –    1 651  22     –    1 500  103     108
              Property payments                               68 860                    28 439                    60 177                  348 458                  556 713                  527 022                  622 661                  241 263                  457 731  18.1
              Transport provided: Departmental activity  –  –  161  –    3 052  697    816    –     –     17.1
              Travel and subsistence                          29 006  9 271                    17 442                    33 098  34 675                    32 557                    23 746                    38 426                    39 653  (27.1)
              Training and development         5 227  3 376  5 723                    13 971  11 170  9 244                    11 012  9 645                    10 077  19.1
              Operating payments                626   887   2 079  3 169  12 697                    11 253  4 055  23  24  (64.0)
              Venues and facilities             928    6     240   1 181  1 097  1 097  1 181  975  1 019  7.7
              Rental and hiring                  –     –      –     –     –      –     –      –       –
             Interest and rent on land           –     –     533    –     –      –     –      –     –
              Interest                           –     –      –     –     –      –     –      –       –
              Rent on land                       –     –     533    –     –      –     –      –     –
            Transfers and subsidies             14    176     –     –     –     137    –      –     –    (100.0)
             Provinces and municipalities        –     –      –     –     –      –     –      –     –
              Provinces                          –     –      –     –     –      –     –      –       –
               Provincial Revenue Funds          –     –      –     –     –      –     –      –     –
               Provincial agencies and funds     –     –      –     –     –      –     –      –       –
              Municipalities                     –     –      –     –     –      –     –      –       –
               Municipalities                    –     –      –     –     –      –     –      –       –
               Municipal agencies and funds      –     –      –     –     –      –     –      –       –
             Departmental agencies and accounts  –     –      –     –     –      –     –      –       –
              Social security funds              –     –      –     –     –      –     –      –       –
              Provide list of entities receiving transfers  –  –  –  –    –      –     –      –       –
             Higher education institutions       –     –      –     –     –      –     –      –       –
             Foreign governments and international organisations  –  –  –  –  –  –     –      –       –
             Public corporations and private enterprises  –  –  –   –     –      –     –      –       –
              Public corporations                –     –      –     –     –      –     –      –     –
               Subsidies on production           –     –      –     –     –      –     –      –     –
               Other transfers                   –     –      –     –     –      –     –      –       –
              Private enterprises                –     –      –     –     –      –     –      –     –
               Subsidies on production           –     –      –     –     –      –     –      –       –
               Other transfers                   –     –      –     –     –      –     –      –     –
             Non-profit institutions
             Households                         14    176     –     –     –     137    –      –     –    (100.0)
              Social benefits                    –     –      –     –     –      –     –      –     –
              Other transfers to households     14    176     –     –     –     137    –      –     –    (100.0)
            Payments for capital assets                  1 369 225                  597 292                  849 542               1 212 924               1 149 953               1 177 592               1 145 825               1 463 157               1 321 369  (2.7)
             Buildings and other fixed structures                1 362 501                  592 565                  844 660               1 210 368               1 147 397               1 175 039               1 143 105               1 460 580               1 318 676  (2.7)
              Buildings                                  1 362 501  –  –  –  –   –     –      –       –
              Other fixed structures             –   592 565                  844 660               1 210 368               1 147 397               1 175 039               1 143 105               1 460 580               1 318 676  (2.7)
             Machinery and equipment           6 724  4 727  4 882  2 556  2 556  2 553  2 720  2 577  2 693  6.5
              Transport equipment              5 076  3 869  794   2 556  2 556  2 553  1 996  2 129  2 225  (21.8)
              Other machinery and equipment    1 648  858   4 088   –     –      –     724   448     468
             Heritage Assets                     –     –      –     –     –      –     –      –     –
             Specialised military assets         –     –      –     –     –      –     –      –       –
             Biological assets                   –     –      –     –     –      –     –      –     –
             Land and sub-soil assets            –     –      –     –     –      –     –      –     –
             Software and other intangible assets  –   –      –     –     –      –     –      –       –
            Payments for financial assets        –     –     265    –     –      –     –      –       –
            Total economic classification                1 745 496               1 275 760               1 431 381               1 959 760               2 299 935               2 299 932               2 073 852               1 950 892               2 037 647  (9.8)


                                                             340
   352   353   354   355   356   357   358   359   360   361   362