
Page 355 - Provincial Treasury Estimates.pdf
P. 355
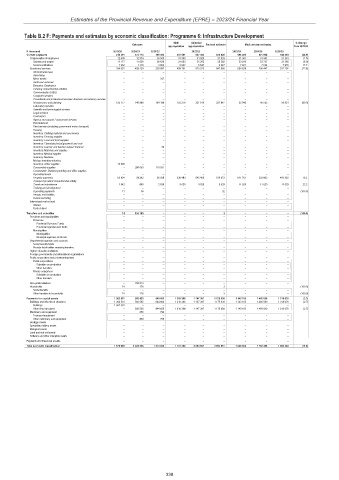
Estimates of the Provincial Revenue and Expenditure (EPRE) – 2023/24 Financial Year
Table B.2 F: Payments and estimates by economic classification: Programme 6: Infrastructure Development
Main Adjusted % change
Outcome Revised estimate Medium-term estimates
appropriation appropriation from 2022/23
R thousand 2019/20 2020/21 2021/22 2022/23 2023/24 2024/25 2025/26
Current payments 216 491 472 113 369 492 531 091 907 454 879 809 686 200 321 808 543 563 (22.0)
Compensation of employees 12 439 12 974 30 500 31 300 31 929 31 929 31 361 31 361 31 361 (1.8)
Salaries and wages 11 177 11 656 26 636 24 653 25 282 25 282 23 540 23 727 23 385 (6.9)
Social contributions 1 262 1 318 3 864 6 647 6 647 6 647 7 821 7 634 7 976 17.7
Goods and services 204 052 459 139 338 992 499 791 875 525 847 880 654 839 290 447 512 202 (22.8)
Administrative fees – – – – – – – – –
Advertising – – – – – – – – –
Minor assets – – 267 – – – – – –
Audit cost: External – – – – – – – – –
Bursaries: Employees – – – – – – – – –
Catering: Departmental activities – – – – – – – – –
Communication (G&S) – – – – – – – – –
Computer services – – – – – – – – –
Consultants and professional services: Business and advisory services – – – – – – – – –
Infrastructure and planning 125 177 140 988 164 199 152 279 321 010 321 847 32 049 45 535 50 921 (90.0)
Laboratory services – – – – – – – – –
Scientific and technological services – – – – – – – – –
Legal services – – – – – – – – –
Contractors – – – – – – – – –
Agency and support / outsourced services – – – – – – – – –
Entertainment – – – – – – – – –
Fleet services (including government motor transport) – – – – – – – – –
Housing – – – – – – – – –
Inventory: Clothing material and accessories – – – – – – – – –
Inventory: Farming supplies – – – – – – – – –
Inventory: Food and food supplies – – – – – – – – –
Inventory: Chemicals,fuel,oil,gas,wood and coal – – – – – – – – –
Inventory: Learner and teacher support material – – 20 – – – – – –
Inventory: Materials and supplies – – – – – – – – –
Inventory: Medical supplies – – – – – – – – –
Inventory: Medicine – – – – – – – – –
Medsas inventory interface – – – – – – – – –
Inventory: Other supplies 13 898 – – – – – – – –
Consumable supplies – 289 063 115 031 – – – – – –
Consumable: Stationery,printing and office supplies – – – – – – – – –
Operating leases – – – – – – – – –
Property payments 63 924 28 392 56 839 338 483 545 486 516 972 611 761 233 883 450 252 18.3
Transport provided: Departmental activity – – – – – – – – –
Travel and subsistence 1 042 660 2 636 9 029 9 029 9 029 11 029 11 029 11 029 22.2
Training and development – – – – – – – – –
Operating payments 11 36 – – – 32 – – – (100.0)
Venues and facilities – – – – – – – – –
Rental and hiring – – – – – – – – –
Interest and rent on land – – – – – – – – –
Interest – – – – – – – – –
Rent on land – – – – – – – – –
Transfers and subsidies 14 156 789 – – – 3 – – – (100.0)
Provinces and municipalities – – – – – – – – –
Provinces – – – – – – – – –
Provincial Revenue Funds – – – – – – – – –
Provincial agencies and funds – – – – – – – – –
Municipalities – – – – – – – – –
Municipalities – – – – – – – – –
Municipal agencies and funds – – – – – – – – –
Departmental agencies and accounts – – – – – – – – –
Social security funds – – – – – – – – –
Provide list of entities receiving transfers – – – – – – – – –
Higher education institutions – – – – – – – – –
Foreign governments and international organisations – – – – – – – – –
Public corporations and private enterprises – – – – – – – – –
Public corporations – – – – – – – – –
Subsidies on production – – – – – – – – –
Other transfers – – – – – – – – –
Private enterprises – – – – – – – – –
Subsidies on production – – – – – – – – –
Other transfers – – – – – – – – –
Non-profit institutions – 156 613 – – – – – – –
Households 14 176 – – – 3 – – – (100.0)
Social benefits – – – – – – – – –
Other transfers to households 14 176 – – – 3 – – – (100.0)
Payments for capital assets 1 362 501 593 423 845 450 1 210 368 1 147 397 1 175 039 1 143 105 1 460 580 1 318 676 (2.7)
Buildings and other fixed structures 1 362 501 592 565 844 660 1 210 368 1 147 397 1 175 039 1 143 105 1 460 580 1 318 676 (2.7)
Buildings 1 362 501 – – – – – – – –
Other fixed structures – 592 565 844 660 1 210 368 1 147 397 1 175 039 1 143 105 1 460 580 1 318 676 (2.7)
Machinery and equipment – 858 790 – – – – – –
Transport equipment – – – – – – – – –
Other machinery and equipment – 858 790 – – – – – –
Heritage Assets – – – – – – – – –
Specialised military assets – – – – – – – – –
Biological assets – – – – – – – – –
Land and sub-soil assets – – – – – – – – –
Software and other intangible assets – – – – – – – – –
Payments for financial assets – – – – – – – – –
Total economic classification 1 579 006 1 222 325 1 214 942 1 741 459 2 054 851 2 054 851 1 829 305 1 782 388 1 862 239 (11.0)
338