Page 350 - Provincial Treasury Estimates.pdf
P. 350

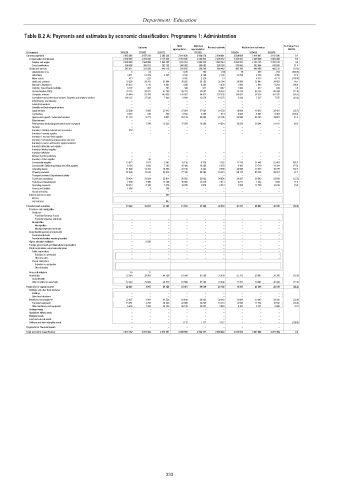
Department: Education

           Table B.2 A: Payments and estimates by economic classification: Programme 1: Administration

                                                                 Main   Adjusted                      % change from
                                                   Outcome                  Revised estimate  Medium-term estimates
                                                               appropriation  appropriation             2022/23
            R thousand                       2019/20  2020/21  2021/22  2022/23     2023/24  2024/25  2025/26
            Current payments                              2 855 296                2 587 319                2 563 336                2 811 438                2 692 578                2 904 821                2 924 659                3 015 497                3 152 500  0.7
             Compensation of employees                    2 309 385                2 254 030                2 116 333                2 301 836                2 296 332                2 296 332                2 434 553                2 549 089                2 663 288  6.0
              Salaries and wages                          2 000 689                1 944 999                1 824 200                1 941 754                1 936 250                1 986 544                2 058 503                2 156 135                2 252 729  3.6
              Social contributions                           308 696                   309 031                   292 133                   360 082                   360 082                   309 788                   376 050                   392 954                   410 559  21.4
             Goods and services                              545 911                   333 289                   446 116                   509 602                   396 246                   608 489                   490 106                   466 408                   489 212  (19.5)
              Administrative fees                5     24     –    1 235  102   (30)   78    675    704  (360.0)
              Advertising                      3 871  21 379  6 345  4 343  6 199  7 190  12 768  4 738  4 950  77.6
              Minor assets                      613   225     –    8 432  2 124  13     –    4 515  4 717  (100.0)
              Audit cost: External             33 228  28 765  21 904  30 202  29 792  25 304  39 000  32 947  34 423  54.1
              Bursaries: Employees             16 833  7 772  6 045  7 246  4 246  1 438  7 000  7 905  8 259  386.8
              Catering: Departmental activities  6 292  982  795   500    972   1 042  1 080  612   639   3.6
              Communication (G&S)              28 118  38 872  42 295  55 228  37 047  35 533  29 326  46 233  48 304  (17.5)
              Computer services                38 544  53 706                   169 936                   126 957  84 471                   337 838                   138 097  97 028                   101 375  (59.1)
              Consultants and professional services: Business and advisory services                   108 137  37 338  7 840  8 509  13 559  14 275  5 226  7 537  7 875  (63.4)
              Infrastructure and planning        –     –      –     –      –     –      –     –      –
              Laboratory services                –     –      –     –      –     –      –     –      –
              Scientific and technological services  –  –     –     –      –     –      –     –      –
              Legal services                   22 599  5 965  22 442  27 094  27 094  24 233  18 000  19 612  20 491  (25.7)
              Contractors                      3 515  378    456   9 159  3 239  314  5 662  6 091  6 364  1703.2
              Agency and support / outsourced services  41 110  9 777  9 351  29 143  30 890  22 795  33 599  36 155  39 687  47.4
              Entertainment                      –     –      –     –      –     –      –     –      –
              Fleet services (including government motor transport)  –  7 796  15 225  17 978  15 268  14 391  20 226  20 244  21 151  40.5
              Housing                            –     –      –     –      –     –      –     –      –
              Inventory: Clothing material and accessories  272                             –    –  –  –  –  –  –  –
              Inventory: Farming supplies        –     –      –     –      –     –      –     –      –
              Inventory: Food and food supplies  –     –      –     –      –     –      –     –      –
              Inventory: Chemicals,fuel,oil,gas,wood and coal  –  –  –  –  –     –      –     –      –
              Inventory: Learner and teacher support material  –  –  –  –  –     –      –     –      –
              Inventory: Materials and supplies  –     –      –     –      –     –      –     –      –
              Inventory: Medical supplies        –     –      –     –      –     –      –     –      –
              Inventory: Medicine                –     –      –     –      –     –      –     –      –
              Medsas inventory interface         –     –      –     –      –     –      –     –      –
              Inventory: Other supplies          –     30     –     –      –     –      –     –      –
              Consumable supplies              13 573  1 017  5 941  13 710  8 739  1 762  11 730  21 446  22 407  565.7
              Consumable: Stationery,printing and office supplies  5 156  1 816  7 192  15 408  10 290  2 353  6 460  13 710  14 324  174.5
              Operating leases                 11 586  12 222  18 369  20 748  9 202  9 358  26 898  17 973  18 778  187.4
              Property payments                67 026  73 578  66 515  77 449  63 082  64 051  88 172  85 446  89 274  37.7
              Transport provided: Departmental activity  –  –  –    –      –     –      –     –      –
              Travel and subsistence           76 424  22 024  29 811  30 562  32 832  34 805  30 567  28 300  29 566  (12.2)
              Training and development         7 038  3 488  10 168  10 900  13 219  7 811  9 211  1 442  1 506  17.9
              Operating payments               60 413  6 128  5 378  14 799  3 879  4 013  7 006  13 799  14 418  74.6
              Venues and facilities            1 558   7     108    –      –     –      –     –        –
              Rental and hiring                  –     –      –     –      –     –      –     –      –
             Interest and rent on land           –     –     887    –      –     –      –     –      –
              Interest                           –     –      –     –      –     –      –     –      –
              Rent on land                       –     –     887    –      –     –      –     –        –
            Transfers and subsidies                            33 429                     36 053                     44 529                     61 590                     61 590                     31 839                     27 761                     29 007                     30 306  (12.8)
             Provinces and municipalities        –     –      –     –      –     –      –     –      –
              Provinces                          –     –      –     –      –     –      –     –      –
               Provincial Revenue Funds          –     –      –     –      –     –      –     –      –
               Provincial agencies and funds     –     –      –     –      –     –      –     –      –
              Municipalities                     –     –      –     –      –     –      –     –      –
               Municipalities                    –     –      –     –      –     –      –     –      –
               Municipal agencies and funds      –     –      –     –      –     –      –     –      –
             Departmental agencies and accounts  –     –      –     –      –     –      –     –      –
              Social security funds              –     –      –     –      –     –      –     –      –
              Provide list of entities receiving transfers  –  –  –  –     –     –      –     –      –
             Higher education institutions       –    6 039   –     –      –     –      –     –      –
             Foreign governments and international organisations  –  –  –  –  –  –      –     –        –
             Public corporations and private enterprises  –  –  –   –      –     –      –     –      –
              Public corporations                –     –      –     –      –     –      –     –      –
               Subsidies on production           –     –      –     –      –     –      –     –      –
               Other transfers                   –     –      –     –      –     –      –     –      –
              Private enterprises                –     –      –     –      –     –      –     –      –
               Subsidies on production           –     –      –     –      –     –      –     –      –
               Other transfers                   –     –      –     –      –     –      –     –      –
             Non-profit institutions            85     31     –     –      –     –      –     –        –
             Households                        33 344  29 983  44 529  61 590  61 590  31 839  27 761  29 007  30 306  (12.8)
              Social benefits                    –     –      –     –      –     –      –     –      –
              Other transfers to households    33 344  29 983  44 529  61 590  61 590  31 839  27 761  29 007  30 306  (12.8)
            Payments for capital assets                        22 027  3 991                     68 526                     63 561                     49 959                     25 180                     18 089                     23 495                     24 548  (28.2)
             Buildings and other fixed structures  –   –      –     –      –     –      –     –      –
              Buildings                          –     –      –     –      –     –      –     –      –
              Other fixed structures             –     –      –     –      –     –      –     –      –
             Machinery and equipment           22 027  3 991  68 526  62 444  48 842  24 063  18 089  23 495  24 548  (24.8)
              Transport equipment              15 551  2 783  34 340  22 699  23 805  18 210  12 595  17 754  18 550  (30.8)
              Other machinery and equipment    6 476  1 208  34 186  39 745  25 037  5 853  5 494  5 741  5 998  (6.1)
             Heritage Assets                     –     –      –     –      –     –      –     –      –
             Specialised military assets         –     –      –     –      –     –      –     –      –
             Biological assets                   –     –      –     –      –     –      –     –      –
             Land and sub-soil assets            –     –      –     –      –     –      –     –      –
             Software and other intangible assets  –   –      –    1 117  1 117  1 117  –     –      –   (100.0)
            Payments for financial assets        –     –      –     –      –     –      –     –      –
            Total economic classification                 2 910 752                2 627 363                2 676 391                2 936 588                2 804 127                2 961 840                2 970 509                3 067 999                3 207 354  0.3


                                                             333
   345   346   347   348   349   350   351   352   353   354   355