
Page 345 - Provincial Treasury Estimates.pdf
P. 345
Estimates of the Provincial Revenue and Expenditure (EPRE) – 2023/24 Financial Year
Expenditure on Compensation of Employees decreased from R213.976 million in 2019/20 to a revised
estimate of R207.637 million in 2022/23. The 2023/24 budget allocation grows positively by 6 per cent,
due to general provision made for the wage agreement.
Expenditure on Goods and Services increased substantially from R185.302 million in 2019/02 to a revised
estimate of R1.206 billion in 2022/23, whilst allocation for 2023/24 increases by 1.7 per cent due to
continued provision for PYEI in respect of educator and general assistants deployed at deserving schools.
Transfers and Subsidies decreased from R102.761 million in 2019/20 to a revised estimate of R128.673
million in 2022/23. The 2023/24 allocation also further decined by 0.2 per cent due to funding constraints.
Capital expenditure grew from R4.755 million in 2019/20 to a revised estimate of R5.691 million in 2022/23,
and subsequently grows even further to R8.142 million in 2023/24 due once-off planned acquisition of
exam related office machines and vehicles.
8.7.1 Service delivery measures
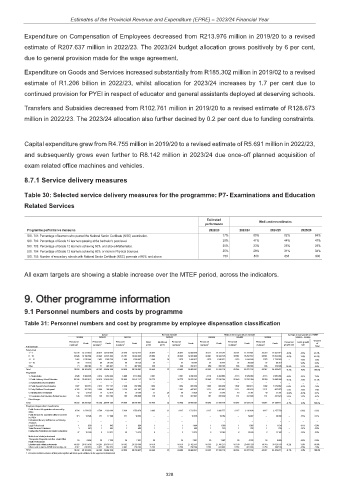
Table 30: Selected service delivery measures for the programme: P7- Examinations and Education
Related Services
Estimated Medium-term estimates
performance
Programme performance measures 2022/23 2023/24 2024/25 2025/26
SOI. 701: Percentage of learners who passed the National Senior Certificate (NSC) examination. 77% 80% 82% 84%
SOI. 702: Percentage of Grade 12 learners passing at the bachelor’s pass level. 38% 41% 44% 47%
SOI. 703: Percentage of Grade 12 learners achieving 60% and above Mathematics. 20% 23% 26% 29%
SOI. 704: Percentage of Grade 12 learners achieving 60% or more in Physical Sciences. 25% 28% 31% 34%
SOI. 705: Number of secondary schools with National Senior Certificate (NSC) pass rate of 60% and above. 750 800 850 900
All exam targets are showing a stable increase over the MTEF period, across the indicators.
9. Other programme information
9.1 Personnel numbers and costs by programme
Table 31: Personnel numbers and cost by programme by employee dispensation classification
Actual Revised estimate Medium-term expenditure estimate Average annual growth over MTEF
2019/20 2020/21 2021/22 2022/23 2023/24 2024/25 2025/26 2022/23 - 2025/26
% Costs
Personnel Personnel Personnel Filled Additional Personnel Personnel Personnel Personnel Personnel Costs growth
numbers 1 Costs numbers 1 Costs numbers 1 Costs posts posts numbers 1 Costs numbers 1 Costs numbers 1 Costs numbers 1 Costs growth rate rate of
R thousands Total
Salary level
1 – 7 43 736 12 337 619 39 917 12 409 556 38 549 12 512 477 36 947 – 36 947 13 889 840 36 311 14 347 347 36 314 15 141 681 36 316 15 831 614 -0.6% 4.5% 45.7%
8 – 10 23 845 14 790 684 23 845 14 876 924 23 751 15 000 305 26 662 3 26 665 14 955 855 26 661 15 326 126 26 661 15 891 572 26 661 16 614 066 -0.0% 3.6% 48.3%
11 – 12 2 482 1 576 544 2 451 1 585 736 2 480 1 598 887 1 546 29 1 575 1 499 827 1 575 1 545 872 1 575 1 644 596 1 575 1 718 748 – 4.6% 5.0%
13 – 16 98 97 735 98 98 305 99 99 120 57 – 57 69 794 57 78 444 57 86 599 57 90 319 – 9.0% 0.3%
Other 71 490 944 71 493 807 71 497 902 238 – 238 250 011 638 260 991 638 262 888 638 274 665 38.9% 3.2% 0.8%
Total 70 232 29 293 526 66 382 29 464 328 64 950 29 708 691 65 450 32 65 482 30 665 327 65 242 31 558 779 65 245 33 027 336 65 247 34 529 411 -0.1% 4.0% 100.0%
Programme
1. Administration 4 545 2 309 385 4 014 2 254 030 3 663 2 116 333 3 591 – 3 591 2 296 332 4 113 2 434 553 4 113 2 549 089 4 113 2 663 288 4.6% 5.1% 7.6%
2. Public Ordinary School Education 59 246 25 669 413 56 626 25 489 361 55 868 26 142 217 56 775 – 56 775 26 876 243 55 845 27 530 784 55 848 28 792 954 55 850 30 085 084 -0.5% 3.8% 87.3%
3. Independent School Subsidies – – – – – – – – – – – – – – – – – – –
4. Public Special School Education 1 927 706 073 2 013 717 137 2 008 762 938 1 954 – 1 954 805 354 1 992 889 396 1 992 955 413 1 992 1 019 862 0.6% 8.2% 2.8%
5. Early Childhood Development 4 326 382 240 3 580 380 046 3 238 421 007 2 983 – 2 983 447 832 3 121 452 683 3 121 476 620 3 121 497 975 1.5% 3.6% 1.4%
6. Infrastructure Development 45 12 439 14 12 974 41 30 500 31 29 60 31 929 40 31 361 40 31 361 40 31 361 -12.6% -0.6% 0.1%
7. Examination And Education Related Services 143 213 976 135 610 780 132 235 696 116 3 119 207 637 131 220 002 131 221 899 131 231 841 3.3% 3.7% 0.7%
Direct charges – – – – – – – – – – – – – – – – – – –
Total 70 232 29 293 526 66 382 29 464 328 64 950 29 708 691 65 450 32 65 482 30 665 327 65 242 31 558 779 65 245 33 027 336 65 247 34 529 411 -0.1% 4.0% 100.0%
Employee dispensation classification
Public Service Act appointees not covered by
OSDs 6 764 1 974 155 6 764 2 039 144 5 434 2 550 078 9 085 32 9 117 2 733 522 9 117 2 986 777 9 117 3 119 406 9 117 3 257 750 – 6.0% 9.3%
Public Service Act appointees still to be covered 471 16 396 471 17 298 471 18 252 – – – 18 249 – 19 052 – 19 907 – 20 799 – 4.5% 0.1%
by OSDs
Professional Nurses, Staff Nurses and Nursing – – – - - – – - - – - – - – – – –
Assistants
Legal Professionals 1 893 1 942 1 994 1 – 1 1 004 1 1 038 1 1 085 1 1 134 – 4.1% 0.0%
Social Services Professions 1 620 1 654 1 690 1 – 1 690 1 720 1 752 1 786 – 4.4% 0.0%
Engineering Professions and related occupations 37 10 300 8 10 971 40 11 574 8 – 8 11 574 8 12 083 8 12 626 8 13 192 – 4.5% 0.0%
Medical and related professionals – – – - - – – - - – - – - – – – –
Therapeutic, Diagnostic and other related Allied
Health Professionals 20 6 856 20 7 233 20 7 631 20 – 20 7 631 20 7 967 20 8 325 20 8 698 – 4.5% 0.0%
Educators and related professionals 54 026 26 667 436 50 205 26 639 173 50 102 26 329 369 50 576 – 50 576 27 102 553 50 336 27 706 273 50 339 29 003 329 50 341 30 326 533 -0.2% 3.8% 88.0%
Others such as interns, EPWP, learnerships, etc 8 912 616 870 8 912 748 913 8 881 790 103 5 759 – 5 759 790 104 5 759 824 869 5 759 861 906 5 759 900 519 – 4.5% 2.6%
Total 70 232 29 293 526 66 382 29 464 328 64 950 29 708 691 65 450 32 65 482 30 665 327 65 242 31 558 779 65 245 33 027 336 65 247 34 529 411 -0.1% 4.0% 100.0%
1. Personnel numbers includes all filled posts together with those posts additional to the approved establishment
328