
Page 348 - Provincial Treasury Estimates.pdf
P. 348
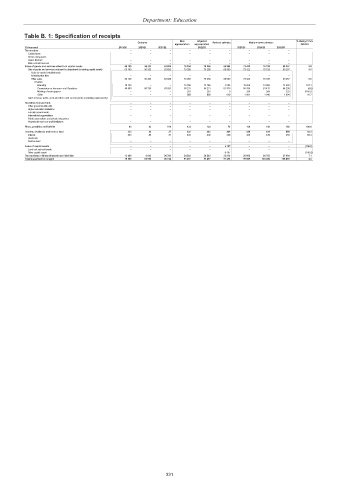
Department: Education

           Table B. 1: Specification of receipts
                                                   Outcome        Main   Adjusted   Revised estimate  Medium-term estimates  % change from
                                                                appropriation  appropriation                2022/23
           R thousand                       2019/20  2020/21  2021/22   2022/23       2023/24  2024/25  2025/26
           Tax receipts                         –      –      –      –      –      –      –      –      –
             Casino taxes                       –      –      –      –      –      –      –      –      –
             Horse racing taxes                 –      –      –      –      –      –      –      –      –
             Liquor licences                    –      –      –      –      –      –      –      –      –
             Motor vehicle licences             –      –      –      –      –      –      –      –      –
           Sales of goods and services other than capital assets  66 100  56 333  63 826  70 258  70 258  66 860  73 422  76 728  80 257  9.8
             Sale of goods and services produced by department (excluding capital assets)  66 100  56 333  63 826  70 258  70 258  66 860  73 422  76 728  80 257  9.8
              Sales by market establishments    –      –      –      –      –      –      –      –        –
              Administrative fees               –      –      –      –      –      –      –      –        –
              Other sales                     66 100  56 333  63 826  70 258  70 258  66 860  73 422  76 728  80 257  9.8
               Of which
                Boarding                      19 120   –      –    12 786  12 786  4 653  13 360  13 960  14 602  187.1
                Commission on Insurance and Garnishee  46 980  56 333  63 826  56 231  56 231  61 579  58 765  61 413  64 238  (4.6)
                Marking of exam papers          –      –      –     283    283     9     296    309    323    3188.9
                Other                           –      –      –     958    958    619    1 001  1 046  1 094   61.7
             Sales of scrap, waste, arms and other used current goods (excluding capital assets)  –  –  –  –  –  –  –  –  –
           Transfers received from:             –      –      –      –      –      –      –      –        –
             Other governmental units           –      –      –      –      –      –      –      –      –
             Higher education institutions      –      –      –      –      –      –      –      –        –
             Foreign governments                –      –      –      –      –      –      –      –        –
             International organisations        –      –      –      –      –      –      –      –        –
             Public corporations and private enterprises  –  –  –    –      –      –      –      –      –
             Households and non-profit institutions  –  –     –      –      –      –      –      –      –
           Fines, penalties and forfeits        93     43    110    134    134     70    140    146    153    100.0
           Interest, dividends and rent on land  223   84     37    402    402    229    420    439    459     83.4
             Interest                           223    84     37    402    402    229    420    439    459     83.4
             Dividends                          –      –      –      –      –      –      –      –      –
             Rent on land                       –      –      –      –      –      –      –      –      –
           Sales of capital assets              –      –      –      –      –     6 167   –      –      –     (100.0)
             Land and sub-soil assets           –      –      –      –      –      –      –      –        –
             Other capital assets               –      –      –      –      –     6 167   –      –      –     (100.0)
           Transactions in financial assets and liabilities  13 090  8 603  26 769  24 503  24 503  23 910  25 603  26 753  27 984  7.1
           Total departmental receipts        79 506  65 063  90 742  95 297  95 297  97 236  99 585                   104 066                   108 853  2.4


                                                             331