
Page 349 - Provincial Treasury Estimates.pdf
P. 349
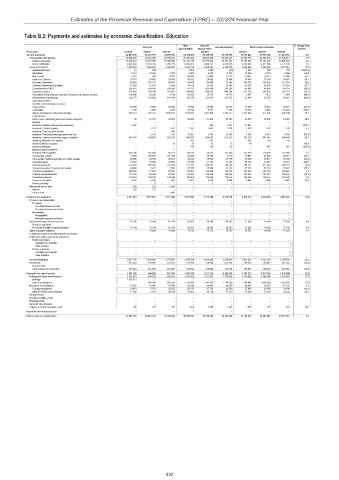
Estimates of the Provincial Revenue and Expenditure (EPRE) – 2023/24 Financial Year
Table B.2: Payments and estimates by economic classification: Education
Outcome Main Adjusted Revised estimate Medium-term estimates % change from
appropriation appropriation 2022/23
R thousand 2019/20 2020/21 2021/22 2022/23 2023/24 2024/25 2025/26
Current payments 32 883 195 32 504 795 33 293 395 34 052 808 35 462 999 35 459 760 36 015 220 36 056 762 37 904 972 1.6
Compensation of employees 29 293 526 29 464 328 29 708 691 29 789 293 30 662 905 30 665 327 31 558 779 33 027 336 34 529 411 2.9
Salaries and wages 25 209 032 25 276 098 25 500 462 25 706 270 26 578 068 26 415 782 27 198 921 28 505 332 29 806 303 3.0
Social contributions 4 084 494 4 188 230 4 208 229 4 083 023 4 084 837 4 249 545 4 359 858 4 522 004 4 723 108 2.6
Goods and services 3 589 440 3 040 255 3 583 284 4 263 515 4 800 094 4 794 433 4 456 440 3 029 426 3 375 561 (7.0)
Administrative fees 21 229 – 2 500 1 382 (30) 1 021 766 799 (3503.3)
Advertising 5 112 22 235 7 079 4 907 6 730 7 400 14 046 5 749 6 006 89.8
Minor assets 2 513 939 4 328 68 566 37 440 37 478 50 043 15 313 15 998 33.5
Audit cost: External 33 353 28 882 24 204 30 352 29 642 25 304 39 000 33 104 34 587 54.1
Bursaries: Employees 90 683 116 172 80 504 98 565 84 065 72 189 100 745 106 433 111 201 39.6
Catering: Departmental activities 61 920 12 497 6 588 18 426 24 203 22 406 36 237 38 556 40 284 61.7
Communication (G&S) 368 675 289 816 108 005 58 727 303 548 391 936 43 943 46 668 48 759 (88.8)
Computer services 325 881 195 148 274 052 544 888 496 558 495 744 321 193 302 659 316 218 (35.2)
Consultants and professional services: Business and advisory services 109 688 38 292 8 318 10 520 15 570 14 775 5 247 7 613 7 954 (64.5)
Infrastructure and planning 125 177 140 988 164 199 152 279 321 010 321 847 32 049 45 535 50 921 (90.0)
Laboratory services – – – – – – – – –
Scientific and technological services – – – – – – – – –
Legal services 22 599 5 965 22 442 27 094 27 094 24 233 18 000 19 612 20 491 (25.7)
Contractors 7 746 1 265 2 787 20 723 5 441 1 495 10 294 9 815 10 255 588.6
Agency and support / outsourced services 516 131 552 373 1 436 613 1 281 825 1 285 299 1 291 477 1 473 953 377 205 396 016 14.1
Entertainment – – – – – – – – –
Fleet services (including government motor transport) 89 12 722 20 467 22 862 21 443 26 795 34 518 23 900 24 970 28.8
Housing – – – – – – – – –
Inventory: Clothing material and accessories 5 307 – – – 600 1 022 15 647 – – 1431.0
Inventory: Farming supplies – 1 127 1 412 2 161 2 463 1 874 1 875 102 107 0.1
Inventory: Food and food supplies – – 296 – – – – – –
Inventory: Chemicals,fuel,oil,gas,wood and coal – 2 133 2 134 12 261 3 761 12 195 4 781 6 441 6 730 (60.8)
Inventory: Learner and teacher support material 617 107 364 070 607 028 654 075 656 867 613 229 791 728 851 343 889 484 29.1
Inventory: Materials and supplies – – – 887 807 – 308 43 45
Inventory: Medical supplies – – 19 73 33 33 80 – – 142.4
Inventory: Medicine – – – 795 129 90 – 887 927 (100.0)
Medsas inventory interface – – – – – – – – –
Inventory: Other supplies 326 795 155 056 86 274 134 213 89 142 147 893 152 428 110 629 115 584 3.1
Consumable supplies 31 854 579 578 123 126 22 782 14 336 6 356 17 947 27 040 28 251 182.4
Consumable: Stationery,printing and office supplies 43 900 44 744 49 241 36 240 35 833 25 778 19 538 34 977 36 543 (24.2)
Operating leases 21 570 25 180 37 665 49 158 21 467 14 722 58 438 34 841 36 401 296.9
Property payments 279 654 196 362 217 054 517 747 828 602 785 765 768 707 471 343 698 118 (2.2)
Transport provided: Departmental activity 30 958 3 427 2 505 28 155 17 906 13 107 32 153 31 524 32 937 145.3
Travel and subsistence 282 830 77 075 78 764 110 461 122 400 130 728 135 543 140 116 145 897 3.7
Training and development 114 722 66 629 93 387 218 222 223 639 182 626 146 632 144 051 150 504 (19.7)
Operating payments 156 623 102 109 124 346 129 050 118 496 122 472 124 386 136 475 142 589 1.6
Venues and facilities 8 532 5 236 447 5 001 4 188 3 494 5 961 6 686 6 985 70.6
Rental and hiring – 6 – – – – – – –
Interest and rent on land 229 212 1 420 – – – – – –
Interest 229 212 – – – – – – –
Rent on land – – 1 420 – – – – – –
Transfers and subsidies 3 227 129 3 851 921 3 131 666 3 212 590 3 115 789 3 116 168 3 919 413 3 414 823 3 697 041 25.8
Provinces and municipalities – – – – – – – – –
Provinces – – – – – – – – –
Provincial Revenue Funds – – – – – – – – –
Provincial agencies and funds – – – – – – – – –
Municipalities – – – – – – – – –
Municipalities – – – – – – – – –
Municipal agencies and funds – – – – – – – – –
Departmental agencies and accounts 70 108 73 344 65 150 68 360 68 360 68 360 71 365 74 569 77 910 4.4
Social security funds – – – – – – – – –
Provide list of entities receiving transfers 70 108 73 344 65 150 68 360 68 360 68 360 71 365 74 569 77 910 4.4
Higher education institutions – 6 039 14 288 15 113 15 113 15 113 15 781 16 490 17 229 4.4
Foreign governments and international organisations – – – – – – – – –
Public corporations and private enterprises – – – – – – – – –
Public corporations – – – – – – – – –
Subsidies on production – – – – – – – – –
Other transfers – – – – – – – – –
Private enterprises – – – – – – – – –
Subsidies on production – – – – – – – – –
Other transfers – – – – – – – – –
Non-profit institutions 2 937 787 3 540 580 2 779 601 2 912 189 2 815 388 2 815 967 3 642 334 3 125 303 3 394 550 29.3
Households 219 234 231 958 272 627 216 928 216 928 216 728 189 933 198 461 207 352 (12.4)
Social benefits – – – – – – – – –
Other transfers to households 219 234 231 958 272 627 216 928 216 928 216 728 189 933 198 461 207 352 (12.4)
Payments for capital assets 1 397 196 606 029 921 304 1 293 788 1 217 218 1 220 078 1 193 617 1 516 106 1 376 688 (2.2)
Buildings and other fixed structures 1 362 973 595 204 845 354 1 210 368 1 147 397 1 175 039 1 145 805 1 460 580 1 318 676 (2.5)
Buildings 1 362 973 – – – – – – – –
Other fixed structures – 595 204 845 354 1 210 368 1 147 397 1 175 039 1 145 805 1 460 580 1 318 676 (2.5)
Machinery and equipment 33 957 10 502 75 685 82 040 68 441 43 659 46 162 55 251 57 725 5.7
Transport equipment 22 851 5 341 35 267 38 175 37 725 32 580 27 954 32 058 33 495 (14.2)
Other machinery and equipment 11 106 5 161 40 418 43 865 30 716 11 079 18 208 23 193 24 230 64.3
Heritage Assets – – – – – – – – –
Specialised military assets – – – – – – – – –
Biological assets – – – – – – – – –
Land and sub-soil assets – – – – – – – – –
Software and other intangible assets 266 323 265 1 380 1 380 1 380 1 650 275 287 19.6
Payments for financial assets – – – – – – – – –
Total economic classification 37 507 520 36 962 745 37 346 365 38 559 185 39 796 006 39 796 006 41 128 250 40 987 691 42 978 701 3.3
332