
Page 344 - Provincial Treasury Estimates.pdf
P. 344
Department: Education
x Payments to SETA: To provide employee HRD in accordance with the Skills Development Act
x Professional Services To provide educators and learners in schools with Departmentally managed
support services.
x Special Projects: To provide for special Departmentally managed intervention projects in the
education system as a whole.
x External Examination: To provide for Departmentally Managed Examination services and
Assessment Services.
x Conditional Grants: To provide for projects specified by the Department of Basic Education that
are applicable to more than one programme and funded from conditional grants:
Table 28: Summary of payments and estimates by programme: P7- Examinations and Education Related
Services
Main Adjusted
Outcome Revised estimate Medium-term estimates % change from
appropriation appropriation
R thousand 2019/20 2020/21 2021/22 2022/23 2023/24 2024/25 2025/26 2022/23
1. Payments To Seta 70 108 73 344 65 150 68 360 68 360 68 360 71 365 74 569 77 910 4.4
2. Professional Services 18 576 3 009 648 32 543 27 188 27 188 33 975 35 499 37 088 25.0
3. External Examinations 370 843 332 313 414 762 382 501 382 501 382 501 404 332 417 263 435 955 5.7
4. Special Projects 1 205 1 158 406 917 601 1 023 675 1 023 675 1 023 675 1 028 592 18 375 19 197 0.5
5. Conditional Grants 46 062 27 196 47 349 44 528 46 897 46 897 45 077 47 060 49 168 (3.9)
Total payments and estimates 506 794 1 594 268 1 445 510 1 551 607 1 548 621 1 548 621 1 583 341 592 766 619 318 2.2
Table 29: Summary of payments and estimates by economic classification: P7- Examinations and Education
Related Services
Main Adjusted
Outcome Revised estimate Medium-term estimates % change from
appropriation appropriation
R thousand 2019/20 2020/21 2021/22 2022/23 2023/24 2024/25 2025/26 2022/23
Current payments 399 278 1 293 947 1 311 655 1 417 231 1 414 245 1 414 257 1 446 833 465 027 485 857 2.3
Compensation of employees 213 976 610 780 235 696 207 624 207 624 207 637 220 002 221 899 231 841 6.0
Goods and services 185 302 683 167 1 075 959 1 209 607 1 206 621 1 206 620 1 226 831 243 128 254 016 1.7
Interest and rent on land – – – – – – – – –
Transfers and subsidies to: 102 761 296 749 128 941 128 685 128 685 128 673 128 366 122 958 128 467 (0.2)
Provinces and municipalities – – – – – – – – –
Departmental agencies and accounts 70 108 73 344 65 150 68 360 68 360 68 360 71 365 74 569 77 910 4.4
Higher education institutions – – 14 288 15 113 15 113 15 113 15 781 16 490 17 229 4.4
Foreign governments and international organisations – – – – – – – – –
Public corporations and private enterprises – – – – – – – – –
Non-profit institutions 32 326 223 390 49 494 45 212 45 212 45 200 41 220 31 899 33 328 (8.8)
Households 327 15 9 – – – – – –
Payments for capital assets 4 755 3 572 4 914 5 691 5 691 5 691 8 142 4 781 4 994 43.1
Buildings and other fixed structures – – – – – – – – –
Machinery and equipment 4 755 3 572 4 914 5 691 5 691 5 691 8 142 4 781 4 994 43.1
Heritage Assets – – – – – – – – –
Specialised military assets – – – – – – – – –
Biological assets – – – – – – – – –
Land and sub-soil assets – – – – – – – – –
Software and other intangible assets – – – – – – – – –
Payments for financial assets – – – – – – – – –
Total economic classification 506 794 1 594 268 1 445 510 1 551 607 1 548 621 1 548 621 1 583 341 592 766 619 318 2.2
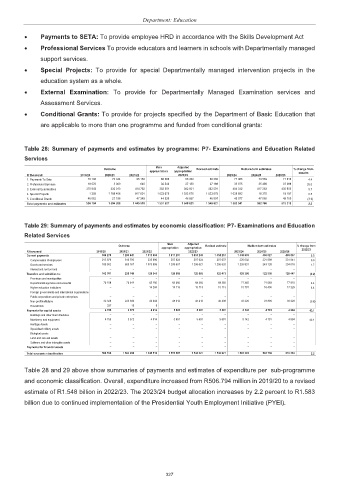
Table 28 and 29 above show summaries of payments and estimates of expenditure per sub-programme
and economic classification. Overall, expenditure increased from R506.794 million in 2019/20 to a revised
estimate of R1.548 billion in 2022/23. The 2023/24 budget allocation increases by 2.2 percent to R1.583
billion due to continued implementation of the Presidential Youth Employment Initiative (PYEI).
327