
Page 340 - Provincial Treasury Estimates.pdf
P. 340
Department: Education
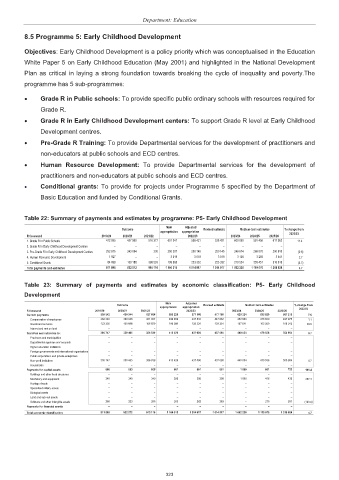
8.5 Programme 5: Early Childhood Development
Objectives: Early Childhood Development is a policy priority which was conceptualised in the Education
White Paper 5 on Early Childhood Education (May 2001) and highlighted in the National Development
Plan as critical in laying a strong foundation towards breaking the cycle of inequality and poverty.The
programme has 5 sub-programmes:
x Grade R in Public schools: To provide specific public ordinary schools with resources required for
Grade R.
x Grade R in Early Childhood Development centers: To support Grade R level at Early Childhood
Development centres.
x Pre-Grade R Training: To provide Departmental services for the development of practitioners and
non-educators at public schools and ECD centres.
x Human Resource Development: To provide Departmental services for the development of
practitioners and non-educators at public schools and ECD centres.
x Conditional grants: To provide for projects under Programme 5 specified by the Department of
Basic Education and funded by Conditional Grants.
Table 22: Summary of payments and estimates by programme: P5- Early Childhood Development
Main Adjusted
Outcome Revised estimate Medium-term estimates % change from
appropriation appropriation 2022/23
R thousand 2019/20 2020/21 2021/22 2022/23 2023/24 2024/25 2025/26
1. Grade R In Public Schools 472 095 457 990 516 377 651 241 538 421 538 421 600 000 591 456 617 952 11.4
2. Grade R In Early Childhood Development Centres – – – – – – – – –
3. Pre-Grade R In Early Childhood Development Centres 252 975 243 894 230 250 387 250 145 250 145 248 614 268 870 280 915 (0.6)
4. Human Resource Development 1 927 – – 3 019 3 019 3 019 3 100 3 293 3 441 2.7
5. Conditional Grants 84 898 130 188 398 503 199 668 223 332 223 332 210 524 255 457 316 616 (5.7)
Total payments and estimates 811 895 832 072 915 110 1 104 315 1 014 917 1 014 917 1 062 238 1 119 076 1 218 924 4.7
Table 23: Summary of payments and estimates by economic classification: P5- Early Childhood
Development
Main Adjusted
Outcome Revised estimate Medium-term estimates % change from
appropriation appropriation 2022/23
R thousand 2019/20 2020/21 2021/22 2022/23 2023/24 2024/25 2025/26
Current payments 505 542 480 944 527 666 690 228 577 166 577 166 620 324 638 829 667 218 7.5
Compensation of employees 382 240 380 046 421 007 499 939 447 832 447 832 452 683 476 620 497 975 1.1
Goods and services 123 302 100 898 106 659 190 289 129 334 129 334 167 641 162 209 169 243 29.6
Interest and rent on land – – – – – – – – –
Transfers and subsidies to: 305 747 350 465 386 839 413 426 437 090 437 090 440 054 479 556 550 984 0.7
Provinces and municipalities – – – – – – – – –
Departmental agencies and accounts – – – – – – – – –
Higher education institutions – – – – – – – – –
Foreign governments and international organisations – – – – – – – – –
Public corporations and private enterprises – – – – – – – – –
Non-profit institutions 305 747 350 465 386 839 413 426 437 090 437 090 440 054 479 556 550 984 0.7
Households – – – – – – – – –
Payments for capital assets 606 663 605 661 661 661 1 860 691 722 181.4
Buildings and other fixed structures – – – – – – – – –
Machinery and equipment 340 340 340 398 398 398 1 860 416 435 367.3
Heritage Assets – – – – – – – – –
Specialised military assets – – – – – – – – –
Biological assets – – – – – – – – –
Land and sub-soil assets – – – – – – – – –
Software and other intangible assets 266 323 265 263 263 263 – 275 287 (100.0)
Payments for financial assets – – – – – – – – –
Total economic classification 811 895 832 072 915 110 1 104 315 1 014 917 1 014 917 1 062 238 1 119 076 1 218 924 4.7
323