
Page 335 - Provincial Treasury Estimates.pdf
P. 335
Estimates of the Provincial Revenue and Expenditure (EPRE) – 2023/24 Financial Year
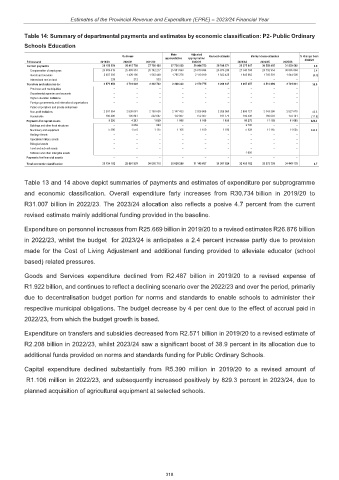
Table 14: Summary of departmental payments and estimates by economic classification: P2- Public Ordinary
Schools Education
Main Adjusted
Outcome Revised estimate Medium-term estimates % change from
appropriation appropriation 2022/23
R thousand 2019/20 2020/21 2021/22 2022/23 2023/24 2024/25 2025/26
Current payments 28 156 950 26 915 768 27 726 199 27 726 939 28 984 753 28 798 671 29 375 847 30 558 455 31 929 682 2.0
Compensation of employees 25 669 413 25 489 361 26 142 217 25 961 663 26 873 834 26 876 243 27 530 784 28 792 954 30 085 084 2.4
Goods and services 2 487 308 1 426 195 1 583 449 1 765 276 2 110 919 1 922 428 1 845 062 1 765 501 1 844 598 (4.0)
Interest and rent on land 229 212 533 – – – – – –
Transfers and subsidies to: 2 571 852 2 731 922 2 322 702 2 300 240 2 179 775 2 208 147 3 067 657 2 510 089 2 701 831 38.9
Provinces and municipalities – – – – – – – – –
Departmental agencies and accounts – – – – – – – – –
Higher education institutions – – – – – – – – –
Foreign governments and international organisations – – – – – – – – –
Public corporations and private enterprises – – – – – – – – –
Non-profit institutions 2 391 354 2 535 081 2 100 635 2 147 433 2 026 968 2 026 968 2 908 127 2 343 396 2 527 670 43.5
Households 180 498 196 841 222 067 152 807 152 807 181 179 159 530 166 693 174 161 (11.9)
Payments for capital assets 5 390 4 213 1 809 1 106 1 109 1 106 10 278 11 165 11 665 829.3
Buildings and other fixed structures – 2 639 694 – – – 2 700 – –
Machinery and equipment 5 390 1 574 1 115 1 106 1 109 1 106 5 928 11 165 11 665 436.0
Heritage Assets – – – – – – – – –
Specialised military assets – – – – – – – – –
Biological assets – – – – – – – – –
Land and sub-soil assets – – – – – – – – –
Software and other intangible assets – – – – – – 1 650 – –
Payments for financial assets – – – – – – – – –
Total economic classification 30 734 192 29 651 903 30 050 710 30 028 285 31 165 637 31 007 924 32 453 782 33 079 709 34 643 178 4.7
Table 13 and 14 above depict summaries of payments and estimates of expenditure per subprogramme
and economic classification. Overall expenditure farly increases from R30.734 billion in 2019/20 to
R31.007 billion in 2022/23. The 2023/24 allocation also reflects a posive 4.7 percent from the current
revised estimate mainly additional funding provided in the baseline.
Expenditure on personnel increases from R25.669 billion in 2019/20 to a revised estimates R26.876 billion
in 2022/23, whilst the budget for 2023/24 is anticipates a 2.4 percent increase partly due to provision
made for the Cost of Living Adjustment and additional funding provided to alleviate educator (school
based) related pressures.
Goods and Services expenditure declined from R2.487 billion in 2019/20 to a revised expense of
R1.922 billion, and continues to reflect a declining scenario over the 2022/23 and over the period, primarily
due to decentralisation budget portion for norms and standards to enable schools to administer their
respective municipal obligations. The budget decrease by 4 per cent due to the effect of accrual paid in
2022/23, from which the budget growth is based.
Expenditure on transfers and subsidies decreased from R2.571 billion in 2019/20 to a revised estimate of
R2.208 billion in 2022/23, whilst 2023/24 saw a significant boost of 38.9 percent in its allocation due to
additional funds provided on norms and standards funding for Public Ordinary Schools.
Capital expenditure declined substantially from R5.390 million in 2019/20 to a revised amount of
R1.106 million in 2022/23, and subsequently increased positively by 829.3 percent in 2023/24, due to
planned acquisition of agricultural equipment at selected schools.
318