
Page 333 - Provincial Treasury Estimates.pdf
P. 333
Estimates of the Provincial Revenue and Expenditure (EPRE) – 2023/24 Financial Year
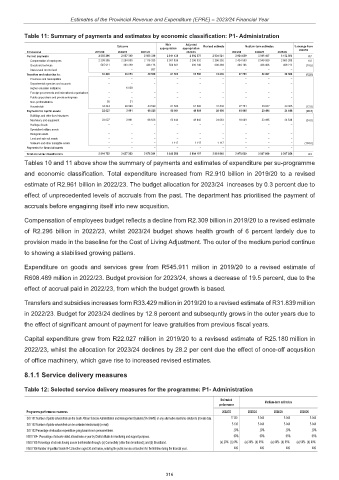
Table 11: Summary of payments and estimates by economic classification: P1- Administration
Main Adjusted
Outcome Revised estimate Medium-term estimates % change from
appropriation appropriation 2022/23
R thousand 2019/20 2020/21 2021/22 2022/23 2023/24 2024/25 2025/26
Current payments 2 855 296 2 587 319 2 563 336 2 811 438 2 692 578 2 904 821 2 924 659 3 015 497 3 152 500 0.7
Compensation of employees 2 309 385 2 254 030 2 116 333 2 301 836 2 296 332 2 296 332 2 434 553 2 549 089 2 663 288 6.0
Goods and services 545 911 333 289 446 116 509 602 396 246 608 489 490 106 466 408 489 212 (19.5)
Interest and rent on land – – 887 – – – – – –
Transfers and subsidies to: 33 429 36 053 44 529 61 590 61 590 31 839 27 761 29 007 30 306 (12.8)
Provinces and municipalities – – – – – – – – –
Departmental agencies and accounts – – – – – – – – –
Higher education institutions – 6 039 – – – – – – –
Foreign governments and international organisations – – – – – – – – –
Public corporations and private enterprises – – – – – – – – –
Non-profit institutions 85 31 – – – – – – –
Households 33 344 29 983 44 529 61 590 61 590 31 839 27 761 29 007 30 306 (12.8)
Payments for capital assets 22 027 3 991 68 526 63 561 49 959 25 180 18 089 23 495 24 548 (28.2)
Buildings and other fixed structures – – – – – – – – –
Machinery and equipment 22 027 3 991 68 526 62 444 48 842 24 063 18 089 23 495 24 548 (24.8)
Heritage Assets – – – – – – – – –
Specialised military assets – – – – – – – – –
Biological assets – – – – – – – – –
Land and sub-soil assets – – – – – – – – –
Software and other intangible assets – – – 1 117 1 117 1 117 – – – (100.0)
Payments for financial assets – – – – – – – – –
Total economic classification 2 910 752 2 627 363 2 676 391 2 936 588 2 804 127 2 961 840 2 970 509 3 067 999 3 207 354 0.3
Tables 10 and 11 above show the summary of payments and estimates of expenditure per su-programme
and economic classification. Total expenditure increased from R2.910 billion in 2019/20 to a revised
estimate of R2.961 billion in 2022/23. The budget allocation for 2023/24 increases by 0.3 percent due to
effect of unprecedented levels of accruals from the past. The department has prioritised the payment of
accruals before engaginng itself into new acqusition.
Compensation of employees budget reflects a decline from R2.309 billion in 2019/20 to a revised estimate
of R2.296 billion in 2022/23, whilst 2023/24 budget shows health growth of 6 percent lardely due to
provision made in the baseline for the Cost of Living Adjustment. The outer of the medium period continue
to showing a stabilised growing pattens.
Expenditure on goods and services grew from R545.911 million in 2019/20 to a revised estimate of
R608.489 million in 2022/23. Budget provision for 2023/24, shows a decrease of 19.5 percent, due to the
effect of accrual paid in 2022/23, from which the budget growth is based.
Transfers and subsidies increases form R33.429 million in 2019/20 to a revised estimate of R31.839 million
in 2022/23. Budget for 2023/24 declines by 12.8 percent and subsequntly grows in the outer years due to
the effect of significant amount of payment for leave gratuities from previous fiscal years.
Capital expenditure grew from R22.027 million in 2019/20 to a revisesd estimate of R25.180 million in
2022/23, whilst the allocation for 2023/24 declines by 28.2 per cent due the effect of once-off acqusition
of office machinery, which gave rise to increased revised estimates.
8.1.1 Service delivery measures
Table 12: Selected service delivery measures for the programme: P1- Administration
Estimated
performance Medium-term estimates
Programme performance measures 2022/23 2023/24 2024/25 2025/26
SOI 101:Number of public schools that use the South African Schools Administration and Management Systems (SA-SAMS) or any alternative electronic solution to provide data. 5 130 5 044 5 044 5 044
SOI 102:Number of public schools that can be contacted electronically (e-mail). 5 130 5 044 5 044 5 044
SOI 103:Percentage of education expenditure going towards non-personnel items. 20% 20% 20% 20%
NSOI 104- :Percentage of schools visited at least twice a year by District officials for monitoring and support purposes. 60% 60% 65% 65%
NSOI 105:Percentage of schools having access to information through: (a) Connectivity (other than broadband); and (b) Broadband. (a) 20% (b) 9% (a) 30% (b) 35% (a) 40% (b) 55% (a) 50% (b) 60%
NSOI 106:Number of qualified Grade R-12 teachers aged 30 and below, entering the public service as teachers for the first time during the financial year. 400 400 400 400
316