Page 330 - Provincial Treasury Estimates.pdf
P. 330

Department: Education

           programme. Add-ons have been made on infrastructure budget for 2023/24, in order to deal with incidents

           of disasters in identified areas of the province.

           7.4.   Expenditure by municipal boundary
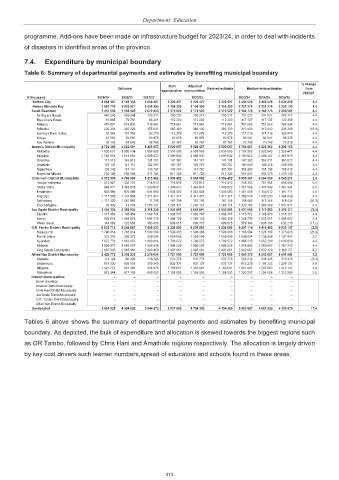
           Table 6: Summary of departmental payments and estimates by benefiting municipal boundary

                                                                                                            % change
                                                              Main   Adjusted
                                            Outcome                         Revised estimate  Medium-term estimates  from
                                                           appropriation appropriation
                                                                                                             2022/23
            R thousand               2019/20  2020/21  2021/22        2022/23         2023/24  2024/25  2025/26
               Buffalo City                      4 064 187      4 143 353          4 630 427          3 320 427          3 320 427                3 320 427      3 466 526      3 466 526      3 621 826  4.4
               Nelson Mandela Bay                3 891 710      3 929 521          3 956 395          2 156 395          2 156 395                2 156 395      2 251 276      2 251 276      2 352 133  4.4
              Sarah Baartman                     1 337 506      1 536 522          2 073 423          2 173 522          2 173 522                2 173 522      2 182 773      2 182 773      2 280 561  0.4
                Dr Beyers Naude                     440 240         455 248             700 217             700 217             700 217                   700 217         731 027         731 027         763 777  4.4
                Blue Crane Route        51 865           79 781               86 201             112 200             112 200                   112 200         117 137         117 137         122 385  4.4
                Makana                              476 501         516 500             719 981             719 981             719 981                   719 981         751 660         751 660         785 334  4.4
                Ndlambe                             220 334         240 023             355 001             380 100             380 100                   380 100         310 440         310 440         324 348  (18.3)
                Sundays River Valley    51 864         101 764               82 279             112 279             112 279                   112 279         117 219         117 219         122 470  4.4
                Kouga                   61 560           94 560               80 978               80 978               80 978  80 978           84 541           84 541           88 328  4.4
                Kou-Kamma               35 142           48 646               48 766               67 767               67 767  67 767           70 749           70 749           73 919  4.4
              Amatole District Municipality                4 732 380      4 922 691          5 428 657          5 520 657          5 520 657                5 520 657      5 763 567      6 022 352      6 292 153  4.4
                Mbhashe                          1 830 031      1 900 034          1 988 585          2 038 585          2 038 585                2 038 585      2 128 283      2 223 843      2 323 471  4.4
                Mnquma                           1 763 854      1 812 854          2 098 632          2 098 632          2 098 632                2 098 632      2 190 972      2 289 347      2 391 910  4.4
                Great Kei                           117 015         145 915             121 181             141 181             141 181                   141 181         147 393         154 011         160 911  4.4
                Amahlathi                           133 142         141 151             162 767             182 767             182 767                   182 767         190 809         199 376         208 308  4.4
                Ngqushwa                            133 142         157 141             145 767             147 767             147 767                   147 767         154 269         161 196         168 418  4.4
                Raymond Mhlaba                      755 196         765 596             911 725             911 725             911 725                   911 725         951 841         994 579      1 039 136  4.4
              Chris Hani District Municipality                4 572 595      4 745 969          5 215 482          5 856 482          5 856 482                5 856 482      5 995 367      6 264 559      6 545 211  2.4
                Inxuba Yethemba                     515 857         535 757             716 813             716 813             716 813                   716 813         748 353         781 954         816 986  4.4
                Intsika Yethu                       993 471      1 063 578          1 299 872          1 349 872          1 349 872                1 349 872      1 357 066      1 417 998      1 481 524  0.5
                Emalahleni                          802 985         876 985             604 593          1 045 593          1 045 593                1 045 593      1 091 599      1 140 612      1 191 711  4.4
                Engcobo                          1 111 959      1 137 959          1 311 377          1 311 377          1 311 377                1 311 377      1 369 078      1 430 550      1 494 639  4.4
                Sakhisizwe                       1 111 420      1 087 987               17 706             167 706             167 706                   167 706         108 485         113 356         118 434  (35.3)
                Enoch Mgijima           36 903           43 703          1 265 121          1 265 121          1 265 121                1 265 121      1 320 786      1 380 089      1 441 917  4.4
              Joe Gqabi District Municipality                2 155 130      2 386 935          2 318 326          3 053 891          3 053 891                3 053 891      3 037 595      3 173 983      3 316 177  (0.5)
                Elundini                         1 017 459      1 105 459          1 068 747          1 068 747          1 068 747                1 068 747      1 115 772      1 165 870      1 218 101  4.4
                Senqu                               993 618      1 048 618          1 086 129          1 286 129          1 286 129                1 286 129      1 342 719      1 403 007      1 465 862  4.4
                Walter Sisulu                       144 053         232 858             163 450             699 015             699 015                   699 015         579 104         605 106         632 215  (17.2)
              O.R. Tambo District Municipality                8 632 712      8 243 887          7 805 233          9 238 593          9 238 593                9 238 593      9 007 114      9 411 492      9 833 127  (2.5)
                Ngquza Hill                      1 740 814      1 765 914          1 500 366          1 598 366          1 598 366                1 598 366      1 168 694      1 221 168      1 275 876  (26.9)
                Port St Johns                       331 343         393 373             559 056          1 059 056          1 059 056                1 059 056      1 088 054      1 136 908      1 187 841  2.7
                Nyandeni                         1 672 770      1 653 053          1 608 804          1 789 572          1 789 572                1 789 572      1 868 313      1 952 200      2 039 659  4.4
                Mhlontlo                         1 999 977      1 546 087          1 646 538          1 896 538          1 896 538                1 896 538      1 979 986      2 068 887      2 161 573  4.4
                King Sabata Dalindyebo                2 887 808      2 885 460          2 490 469          2 895 061          2 895 061                2 895 061      2 902 067      3 032 329      3 168 177  0.2
              Alfred Nzo District Municipality                2 429 772      2 359 235          2 274 050          3 721 659          3 721 659                3 721 659      3 840 375      4 212 807      4 401 541  3.2
                Matatiele                           114 126         160 429             118 725             570 778             570 778                   570 778         523 012         546 495         570 978  (8.4)
                Umzimvubu                           618 530         605 053             399 349             833 137             833 137                   833 137         915 239      1 156 333      1 208 137  9.9
                Mbizana                          1 021 772         916 560             906 976          1 159 691          1 159 691                1 159 691      1 201 917      1 255 883      1 312 147  3.6
                Ntabankulu                          675 344         677 193             849 000          1 158 053          1 158 053                1 158 053      1 200 207      1 254 096      1 310 280  3.6
              District Municipalities      –      –       –       –       –         –      –      –      –
               Sarah Baartman              –      –       –       –       –         –      –      –      –
               Amatole District Municipality  –   –       –       –       –         –      –      –      –
               Chris Hani District Municipality  –  –     –       –       –         –      –      –      –
               Joe Gqabi District Municipality  –  –      –       –       –         –      –      –        –
               O.R. Tambo District Municipality  –  –     –       –       –         –      –      –      –
               Alfred Nzo District Municipality  –  –     –       –       –         –      –      –        –
              Unallocated                        5 691 528      4 694 632          3 644 372          3 517 559          4 754 380                4 754 380      5 583 657      4 001 923      4 335 970  17.4
           Tables 6 above shows the summary of departmental payments and estimates by benefiting municipal
           boundary. As depicted, the bulk of expenditure and allocation is skewed towards the biggest regions such

           as OR Tambo, followed by Chris Hani and Amathole regions respectively. The allocation is largely driven
           by key cost drivers such learner numbers,spread of educators and schools found in these areas.


                                                             313
   325   326   327   328   329   330   331   332   333   334   335