
Page 329 - Provincial Treasury Estimates.pdf
P. 329
Estimates of the Provincial Revenue and Expenditure (EPRE) – 2023/24 Financial Year
7.3. Summary of economic classification
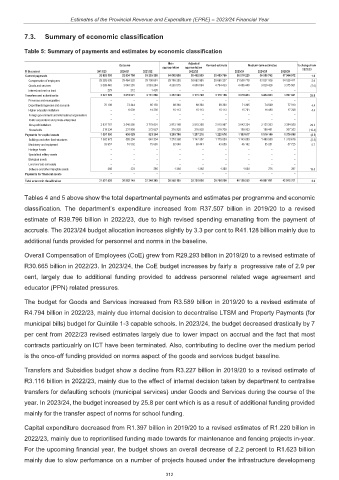
Table 5: Summary of payments and estimates by economic classification
Main Adjusted
Outcome Revised estimate Medium-term estimates % change from
appropriation appropriation
R thousand 2019/20 2020/21 2021/22 2022/23 2023/24 2024/25 2025/26 2022/23
Current payments 32 883 195 32 504 795 33 293 395 34 052 808 35 462 999 35 459 760 36 015 220 36 056 762 37 904 972 1.6
Compensation of employees 29 293 526 29 464 328 29 708 691 29 789 293 30 662 905 30 665 327 31 558 779 33 027 336 34 529 411 2.9
Goods and services 3 589 440 3 040 255 3 583 284 4 263 515 4 800 094 4 794 433 4 456 440 3 029 426 3 375 561 (7.0)
Interest and rent on land 229 212 1 420 – – – – – –
Transfers and subsidies to: 3 227 129 3 851 921 3 131 666 3 212 590 3 115 789 3 116 168 3 919 413 3 414 823 3 697 041 25.8
Provinces and municipalities – – – – – – – – –
Departmental agencies and accounts 70 108 73 344 65 150 68 360 68 360 68 360 71 365 74 569 77 910 4.4
Higher education institutions – 6 039 14 288 15 113 15 113 15 113 15 781 16 490 17 229 4.4
Foreign governments and international organisations – – – – – – – – –
Public corporations and private enterprises – – – – – – – – –
Non-profit institutions 2 937 787 3 540 580 2 779 601 2 912 189 2 815 388 2 815 967 3 642 334 3 125 303 3 394 550 29.3
Households 219 234 231 958 272 627 216 928 216 928 216 728 189 933 198 461 207 352 (12.4)
Payments for capital assets 1 397 196 606 029 921 304 1 293 788 1 217 218 1 220 078 1 193 617 1 516 106 1 376 688 (2.2)
Buildings and other fixed structures 1 362 973 595 204 845 354 1 210 368 1 147 397 1 175 039 1 145 805 1 460 580 1 318 676 (2.5)
Machinery and equipment 33 957 10 502 75 685 82 040 68 441 43 659 46 162 55 251 57 725 5.7
Heritage Assets – – – – – – – – –
Specialised military assets – – – – – – – – –
Biological assets – – – – – – – – –
Land and sub-soil assets – – – – – – – – –
Software and other intangible assets 266 323 265 1 380 1 380 1 380 1 650 275 287 19.6
Payments for financial assets – – – – – – – – –
Total economic classification 37 507 520 36 962 745 37 346 365 38 559 185 39 796 006 39 796 006 41 128 250 40 987 691 42 978 701 3.3
Tables 4 and 5 above show the total departmental payments and estimates per programme and economic
classification. The department’s expenditure increased from R37.507 billion in 2019/20 to a revised
estimate of R39.796 billion in 2022/23, due to high revised spending emanating from the payment of
accruals. The 2023/24 budget allocation increases slightly by 3.3 per cent to R41.128 billion mainly due to
additional funds provided for personnel and norms in the baseline.
Overall Compensation of Employees (CoE) grew from R29.293 billion in 2019/20 to a revised estimate of
R30.665 billion in 2022/23. In 2023/24, the CoE budget increases by fairly a progressive rate of 2.9 per
cent, largely due to additional funding provided to address personnel related wage agreement and
educator (PPN) related pressures.
The budget for Goods and Services increased from R3.589 billion in 2019/20 to a revised estimate of
R4.794 billion in 2022/23, mainly due internal decision to decentralise LTSM and Property Payments (for
municipal bills) budget for Quintile 1-3 capable schools. In 2023/24, the budget decreased drastically by 7
per cent from 2022/23 revised estimates largely due to lower impact on accrual and the fact that most
contracts particualrly on ICT have been terminated. Also, contributing to decline over the medium period
is the once-off funding provided on norms aspect of the goods and services budget baseline.
Transfers and Subsidies budget show a decline from R3.227 billion in 2019/20 to a revised estimate of
R3.116 billion in 2022/23, mainly due to the effect of internal decision taken by department to centralise
transfers for defaulting schools (municipal services) under Goods and Services during the course of the
year. In 2023/24, the budget increased by 25.8 per cent which is as a result of additional funding provided
mainly for the transfer aspect of norms for school funding.
Capital expenditure decreased from R1.397 billion in 2019/20 to a revised estimates of R1.220 billion in
2022/23, mainly due to reprioritised funding made towards for maintenance and fencing projects in-year.
For the upcoming financial year, the budget shows an overall decrease of 2.2 percent to R1.623 billion
mainly due to slow perfomance on a number of projects housed under the infrastructure developmeng
312