
Page 326 - Provincial Treasury Estimates.pdf
P. 326
Department: Education
better value for money and quality. The department will continue the use of small businesses to promote
sustainable job creation.
6. Receipts and financingngg
6.1 Summary of receipts
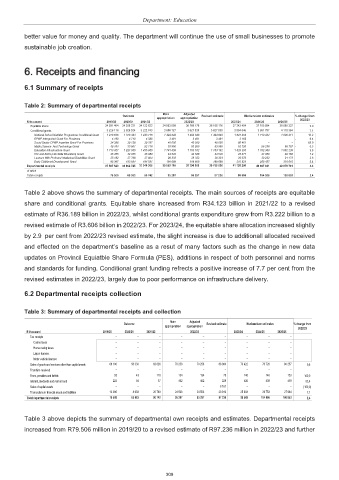
Table 2: Summary of departmental receipts
Main Adjusted
Outcome Revised estimate Medium-term estimates % change from
appropriation appropriation 2022/23
R thousand 2019/20 2020/21 2021/22 2022/23 2023/24 2024/25 2025/26
Equitable share 34 281 404 34 036 221 34 123 622 34 953 058 36 168 176 36 168 176 37 243 404 37 105 894 38 860 337 3.0
Conditional grants 3 226 116 2 926 524 3 222 743 3 606 127 3 627 830 3 627 830 3 884 846 3 881 797 4 118 364 7.1
National School Nutrition Programme Conditional Grant 1 278 635 1 376 343 1 443 715 1 494 648 1 494 648 1 494 648 1 647 454 1 710 422 1 800 411 10.2
EPWP Intergrated Grant For Provinces 4 190 4 710 4 586 3 491 3 491 3 491 3 162 – – - 9.4
Social Sector EPWP Incentive Grant For Provinces 24 396 29 138 29 797 40 050 40 050 40 050 66 461 – – 65.9
Maths,Science And Technology Grant 49 434 33 561 52 116 53 950 53 950 53 950 53 793 56 238 58 757 - 0.3
Education Infrastructure Grant 1 713 427 1 227 035 1 435 855 1 741 459 1 763 162 1 763 162 1 829 305 1 782 388 1 862 239 3.8
HIV and AIDS (Life Skills Education) Grant 45 455 34 035 45 089 44 528 44 528 44 528 45 077 47 060 49 168 1.2
Leaners With Profound Intellectual Disabilities Grant 25 182 27 768 27 004 28 333 28 333 28 333 29 070 30 232 31 173 2.6
Early Childhood Development Grant 85 397 193 934 184 581 199 668 199 668 199 668 210 524 255 457 316 616 5.4
Departmental receipts 37 507 520 36 962 745 37 346 365 38 559 185 39 796 006 39 796 006 41 128 250 40 987 691 42 978 701 3.3
of which
Total receipts 79 506 65 063 90 742 95 297 95 297 97 236 99 585 104 066 108 853 2.4
Table 2 above shows the summary of departmental receipts. The main sources of receipts are equitable
share and conditional grants. Equitable share increased from R34.123 billion in 2021/22 to a revised
estimate of R36.189 billion in 2022/23, whilst conditional grants expenditure grew from R3.222 billion to a
revised estimate of R3.606 billion in 2022/23. For 2023/24, the equitable share allocation increased slightly
by 2.9 per cent from 2022/23 revised estimate, the slight increase is due to additionall allocated received
and effected on the department’s baseline as a resut of many factors such as the change in new data
updates on Provincil Equiatble Share Formula (PES), additions in respect of both personnel and norms
and standards for funding. Conditional grant funding refrects a positive increase of 7.7 per cent from the
revised estimates in 2022/23, largely due to poor performance on infrastructure delivery.
6.2 Departmental receipts collection
Table 3: Summary of departmental receipts and collection
Main Adjusted
Outcome Revised estimate Medium-term estimates % change from
appropriation appropriation
2022/23
R thousand 2019/20 2020/21 2021/22 2022/23 2023/24 2024/25 2025/26
Tax receipts – – – – – – – – –
Casino taxes – – – – – – – – –
Horse racing taxes – – – – – – – – –
Liquor licences – – – – – – – – –
Motor vehicle licences – – – – – – – – –
Sales of goods and services other than capital assets 66 100 56 333 63 826 70 258 70 258 66 860 73 422 76 728 80 257 9,8
Transfers received – – – – – – – – –
Fines, penalties and forfeits 93 43 110 134 134 70 140 146 153 100,0
Interest, dividends and rent on land 223 84 37 402 402 229 420 439 459 83,4
Sales of capital assets – – – – – 6 167 – – – (100,0)
Transactions in financial assets and liabilities 13 090 8 603 26 769 24 503 24 503 23 910 25 603 26 753 27 984 7,1
Total departmental receipts 79 506 65 063 90 742 95 297 95 297 97 236 99 585 104 066 108 853 2,4
Table 3 above depicts the summary of departmental own receipts and estimates. Departmental receipts
increased from R79.506 million in 2019/20 to a revised estimate of R97.236 million in 2022/23 and further
309