
Page 337 - Provincial Treasury Estimates.pdf
P. 337
Estimates of the Provincial Revenue and Expenditure (EPRE) – 2023/24 Financial Year
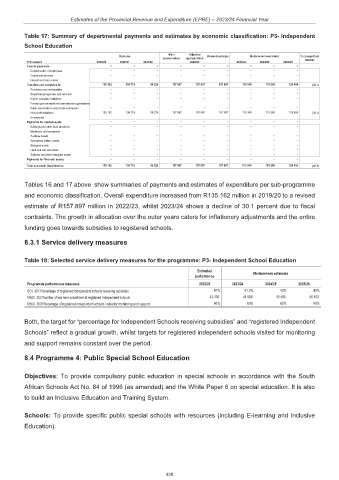
Table 17: Summary of departmental payments and estimates by economic classification: P3- Independent
School Education
Main Adjusted
Outcome Revised estimate Medium-term estimates % change from
appropriation appropriation 2022/23
R thousand 2019/20 2020/21 2021/22 2022/23 2023/24 2024/25 2025/26
Current payments – – – – – – – – –
Compensation of employees – – – – – – – – –
Goods and services – – – – – – – – –
Interest and rent on land – – – – – – – – –
Transfers and subsidies to: 135 162 138 718 99 226 157 897 157 897 157 897 110 345 115 299 120 464 (30.1)
Provinces and municipalities – – – – – – – – –
Departmental agencies and accounts – – – – – – – – –
Higher education institutions – – – – – – – – –
Foreign governments and international organisations – – – – – – – – –
Public corporations and private enterprises – – – – – – – – –
Non-profit institutions 135 162 138 718 99 226 157 897 157 897 157 897 110 345 115 299 120 464 (30.1)
Households – – – – – – – – –
Payments for capital assets – – – – – – – – –
Buildings and other fixed structures – – – – – – – – –
Machinery and equipment – – – – – – – – –
Heritage Assets – – – – – – – – –
Specialised military assets – – – – – – – – –
Biological assets – – – – – – – – –
Land and sub-soil assets – – – – – – – – –
Software and other intangible assets – – – – – – – – –
Payments for financial assets – – – – – – – – –
Total economic classification 135 162 138 718 99 226 157 897 157 897 157 897 110 345 115 299 120 464 (30.1)
Tables 16 and 17 above show summaries of payments and estimates of expenditure per sub-programme
and economic classification. Overall expenditure increased from R135.162 million in 2019/20 to a revised
estimate of R157.897 million in 2022/23, whilst 2023/24 shows a decline of 30.1 percent due to fiscal
contraints. The growth in allocation over the outer years caters for inflationery adjustments and the entire
funding goes towards subsidies to registered schools.
8.3.1 Service delivery measures
Table 18: Selected service delivery measures for the programme: P3- Independent School Education
Estimated Medium-term estimates
performance
Programme performance measures 2022/23 2023/24 2024/25 2025/26
SOI. 301:Percentage of registered independent schools receiving subsidies. 47% 41.3% 43% 45%
NSOI. 302:Number of learners subsidized at registered independent schools. 43 000 44 598 45 490 46 400
NSOI. 303:Percentage of registered independent schools visited for monitoring and support. 60% 60% 60% 60%
Both, the target for “percentage for Independent Schools receiving subsidies” and “registered Independent
Schools” reflect a gradual growth, whilst targets for registered independent schools visited for monitoring
and support remains constant over the period.
8.4 Programme 4: Public Special School Education
Objectives: To provide compulsory public education in special schools in accordance with the South
African Schools Act No. 84 of 1996 (as amended) and the White Paper 6 on special education. It is also
to build an Inclusive Education and Training System.
Schools: To provide specific public special schools with resources (including E-learning and Inclusive
Education).
320