
Page 342 - Provincial Treasury Estimates.pdf
P. 342
Department: Education
8.6 Programme 6: Infrastructure Development
Objectives: To provide and maintain infrastructure facilities for schools and non-schools.The programme
has 4 sub-programmes:
x Administration: To provide goods and services required for the office infrastructure development
and maintenance.
x Public Ordinary Schools: To provide goods and services required for public ordinary schools
(mainstream and full-service schools) infrastructure development and maintenance.
x Special Schools: To provide goods and services required for special school’s infrastructure
development and maintenance.
x Early Childhood Development: To provide goods and services required for the early childhood
development infrastructure development and maintenance.
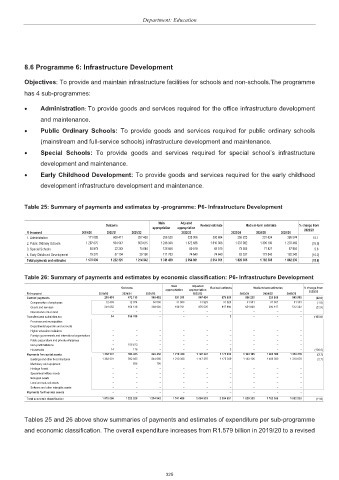
Table 25: Summary of payments and estimates by -programme: P6- Infrastructure Development
Main Adjusted
Outcome Revised estimate Medium-term estimates % change from
appropriation appropriation
R thousand 2019/20 2020/21 2021/22 2022/23 2023/24 2024/25 2025/26 2022/23
1. Administration 171 088 608 411 257 453 256 520 238 006 300 684 355 223 231 624 395 574 18.1
2. Public Ordinary Schools 1 297 675 554 547 853 615 1 246 308 1 672 686 1 610 008 1 337 992 1 305 100 1 270 469 (16.9)
3. Special Schools 30 873 22 263 74 684 126 848 69 519 69 519 73 553 71 821 67 954 5.8
4. Early Childhood Development 79 370 37 104 29 190 111 783 74 640 74 640 62 537 173 843 128 242 (16.2)
Total payments and estimates 1 579 006 1 222 325 1 214 942 1 741 459 2 054 851 2 054 851 1 829 305 1 782 388 1 862 239 (11.0)
Table 26: Summary of payments and estimates by economic classification: P6- Infrastructure Development
Main Adjusted
Outcome Revised estimate Medium-term estimates % change from
appropriation appropriation
R thousand 2019/20 2020/21 2021/22 2022/23 2023/24 2024/25 2025/26 2022/23
Current payments 216 491 472 113 369 492 531 091 907 454 879 809 686 200 321 808 543 563 (22.0)
Compensation of employees 12 439 12 974 30 500 31 300 31 929 31 929 31 361 31 361 31 361 (1.8)
Goods and services 204 052 459 139 338 992 499 791 875 525 847 880 654 839 290 447 512 202 (22.8)
Interest and rent on land – – – – – – – – –
Transfers and subsidies to: 14 156 789 – – – 3 – – – (100.0)
Provinces and municipalities – – – – – – – – –
Departmental agencies and accounts – – – – – – – – –
Higher education institutions – – – – – – – – –
Foreign governments and international organisations – – – – – – – – –
Public corporations and private enterprises – – – – – – – – –
Non-profit institutions – 156 613 – – – – – – –
Households 14 176 – – – 3 – – – (100.0)
Payments for capital assets 1 362 501 593 423 845 450 1 210 368 1 147 397 1 175 039 1 143 105 1 460 580 1 318 676 (2.7)
Buildings and other fixed structures 1 362 501 592 565 844 660 1 210 368 1 147 397 1 175 039 1 143 105 1 460 580 1 318 676 (2.7)
Machinery and equipment – 858 790 – – – – – –
Heritage Assets – – – – – – – – –
Specialised military assets – – – – – – – – –
Biological assets – – – – – – – – –
Land and sub-soil assets – – – – – – – – –
Software and other intangible assets – – – – – – – – –
Payments for financial assets – – – – – – – – –
Total economic classification 1 579 006 1 222 325 1 214 942 1 741 459 2 054 851 2 054 851 1 829 305 1 782 388 1 862 239 (11.0)
Tables 25 and 26 above show summaries of payments and estimates of expenditure per sub-programme
and economic classification. The overall expenditure increases from R1.579 billion in 2019/20 to a revised
325