
Page 346 - Provincial Treasury Estimates.pdf
P. 346
Department: Education
Tables 31 above depicts departmental personnel numbers which are primarily made up of the posts
declared in the Post Provisioning Norm for schools under Public Ordinary Schools and Special Schools
and the approved Organogram for Office based support staff under Administration. Early Childhood
Development provides for the employment of Grade R Practitioners in ECDs, whilst Infrastructure
Development personnel numbers represent the support staff in terms of the Human Resource Capacitation
project within the Education Infrastructure Grant. Programme 7 consists of the number of exam assistants
who support the year-end and supplementary examination processes.
9.2 Information on training
Table 32: Information on training
Main Adjusted
Outcome Revised estimate Medium-term estimates % change from
appropriation appropriation
R thousand 2019/20 2020/21 2021/22 2022/23 2023/24 2024/25 2025/26 2022/23
Number of staff 70 232 66 382 64 950 65 482 65 482 65 482 65 242 65 245 65 247 (0.4)
Number of personnel trained 16 577 8 351 10 880 22 880 22 880 22 880 22 880 22 880 22 880 0.0
of which
Male 7 665 1 552 4 152 9 152 9 152 9 152 9 152 9 152 9 152 0.0
Female 8 912 6 799 6 728 13 728 13 728 13 728 13 728 13 728 13 728 0.0
Number of training opportunities 48 23 29 50 50 50 50 50 50 0.0
of which
Tertiary 15 7 9 16 16 16 16 16 16 0.0
Workshops 25 13 15 26 26 26 26 26 26 0.0
Seminars – – – – – – – – –
Other 8 3 5 8 8 8 8 8 8 0.0
Number of bursaries offered 3 337 1 322 2 971 3 521 3 521 3 521 3 521 3 521 3 521 0.0
Number of interns appointed 501 595 700 700 700 700 700 700 700 0.0
Number of learnerships appointed 100 68 85 100 100 100 100 100 100 0.0
Number of days spent on training 5 3 5 5 5 5 5 5 5 0.0
Payments on training by programme
1. Administration 7 038 3 488 10 168 10 900 10 900 10 900 1 380 1 442 1 507 (87.3)
2. Public Ordinary School Education 90 835 36 291 50 565 100 649 100 649 100 649 103 313 107 952 112 788 2.6
3. Independent School Subsidies – – – – – – – – –
4. Public Special School Education 1 663 3 365 352 7 393 7 393 7 393 6 614 6 911 7 221 (10.5)
5. Early Childhood Development 12 189 2 266 102 27 079 27 079 27 079 26 395 27 580 28 816 (2.5)
6. Infrastructure Development – – – – – – – – –
7. Examination And Education Related Services 2 997 21 219 32 200 72 201 72 201 72 201 73 261 4 006 4 185 1.5
Total payments on training 114 722 66 629 93 387 218 222 218 222 218 222 210 963 147 891 154 517 (3.3)
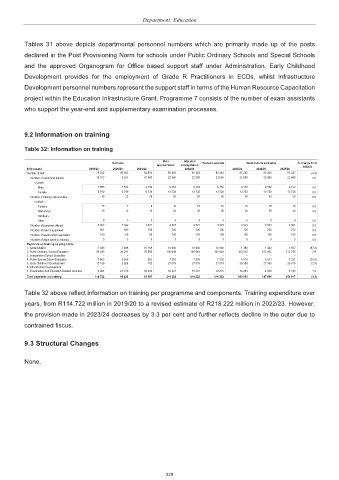
Table 32 above reflect information on training per programme and components. Training expenditure over
years, from R114.722 million in 2019/20 to a revised estimate of R218.222 million in 2022/23. However,
the provision made in 2023/24 decreases by 3.3 per cent and further reflects decline in the outer due to
contrained fiscus.
9.3 Structural Changes
None.
329