
Page 351 - Provincial Treasury Estimates.pdf
P. 351
Estimates of the Provincial Revenue and Expenditure (EPRE) – 2023/24 Financial Year
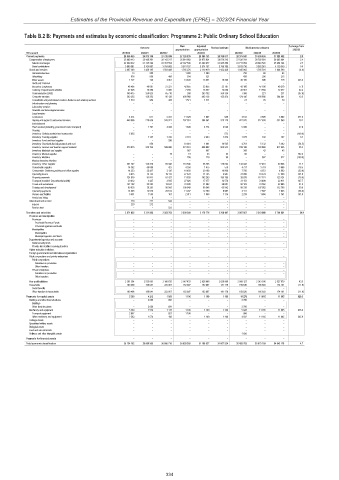
Table B.2 B: Payments and estimates by economic classification: Programme 2: Public Ordinary School Education
Outcome Main Adjusted Revised estimate Medium-term estimates % change from
appropriation appropriation 2022/23
R thousand 2019/20 2020/21 2021/22 2022/23 2023/24 2024/25 2025/26
Current payments 28 156 950 26 915 768 27 726 199 27 726 939 28 984 753 28 798 671 29 375 847 30 558 455 31 929 682 2.0
Compensation of employees 25 669 413 25 489 361 26 142 217 25 961 663 26 873 834 26 876 243 27 530 784 28 792 954 30 085 084 2.4
Salaries and wages 22 009 032 21 735 294 22 357 554 22 387 506 23 299 677 23 085 458 23 717 054 24 840 593 25 954 744 2.7
Social contributions 3 660 381 3 754 067 3 784 663 3 574 157 3 574 157 3 790 785 3 813 730 3 952 361 4 130 340 0.6
Goods and services 2 487 308 1 426 195 1 583 449 1 765 276 2 110 919 1 922 428 1 845 062 1 765 501 1 844 598 (4.0)
Administrative fees 13 205 – 1 265 1 280 – 756 60 63
Advertising 876 856 488 354 321 – 438 206 215
Minor assets 1 727 138 4 061 14 833 13 051 15 200 49 156 688 719 223.4
Audit cost: External – – – – – – – – –
Bursaries: Employees 48 495 46 697 27 227 42 855 32 855 23 787 42 100 47 196 49 310 77.0
Catering: Departmental activities 47 906 10 386 5 085 7 299 13 557 12 660 20 561 11 559 12 077 62.4
Communication (G&S) 340 415 250 623 65 710 240 263 192 350 334 7 386 221 231 (97.9)
Computer services 283 235 138 352 95 128 408 980 403 136 153 474 174 145 195 866 204 641 13.5
Consultants and professional services: Business and advisory services 1 510 954 478 1 511 1 511 – 21 76 79
Infrastructure and planning – – – – – – – – –
Laboratory services – – – – – – – – –
Scientific and technological services – – – – – – – – –
Legal services – – – – – – – – –
Contractors 4 214 811 2 331 11 329 1 967 946 4 512 3 505 3 662 377.0
Agency and support / outsourced services 449 996 218 636 526 921 287 951 304 561 329 118 422 075 317 638 331 869 28.2
Entertainment – – – – – – – – –
Fleet services (including government motor transport) – 2 761 3 436 1 640 4 774 4 500 5 940 – – 32.0
Housing – – – – – – – – –
Inventory: Clothing material and accessories 5 035 – – – – 573 – – – (100.0)
Inventory: Farming supplies – 1 127 1 412 2 161 2 463 1 874 1 875 102 107 0.1
Inventory: Food and food supplies – – 296 – – – – – –
Inventory: Chemicals,fuel,oil,gas,wood and coal – 850 – 10 661 1 861 10 505 4 781 5 132 5 362 (54.5)
Inventory: Learner and teacher support material 570 975 343 733 589 080 574 510 608 982 565 344 709 198 782 863 817 935 25.4
Inventory: Materials and supplies – – – 887 807 – 308 43 45
Inventory: Medical supplies – – 19 73 33 33 80 – – 142.4
Inventory: Medicine – – – 795 129 90 – 887 927 (100.0)
Medsas inventory interface – – – – – – – – –
Inventory: Other supplies 291 747 138 276 69 348 110 566 58 765 118 692 132 628 77 418 80 886 11.7
Consumable supplies 14 362 68 088 427 4 350 1 475 578 4 731 3 719 3 886 718.5
Consumable: Stationery,printing and office supplies 14 223 23 437 2 135 10 450 20 168 16 806 7 750 4 673 4 883 (53.9)
Operating leases 9 915 12 753 19 113 27 870 11 725 4 987 31 000 16 279 17 008 521.6
Property payments 124 919 91 911 81 427 71 828 192 293 185 705 39 679 117 174 122 424 (78.6)
Transport provided: Departmental activity 30 632 3 427 2 505 27 626 17 377 12 578 31 153 31 499 32 911 147.7
Travel and subsistence 137 162 22 254 13 644 31 335 41 582 38 001 50 102 31 552 32 966 31.8
Training and development 90 835 36 291 50 565 100 649 98 546 65 542 98 338 107 952 112 788 50.0
Operating payments 14 035 12 070 22 512 11 247 12 700 9 987 4 111 7 507 7 843 (58.8)
Venues and facilities 5 081 1 553 101 2 011 1 808 1 114 2 239 1 686 1 761 101.0
Rental and hiring – 6 – – – – – – –
Interest and rent on land 229 212 533 – – – – – –
Interest 229 212 – – – – – – –
Rent on land – – 533 – – – – – –
Transfers and subsidies 2 571 852 2 731 922 2 322 702 2 300 240 2 179 775 2 208 147 3 067 657 2 510 089 2 701 831 38.9
Provinces and municipalities – – – – – – – – –
Provinces – – – – – – – – –
Provincial Revenue Funds – – – – – – – – –
Provincial agencies and funds – – – – – – – – –
Municipalities – – – – – – – – –
Municipalities – – – – – – – – –
Municipal agencies and funds – – – – – – – – –
Departmental agencies and accounts – – – – – – – – –
Social security funds – – – – – – – – –
Provide list of entities receiving transfers – – – – – – – – –
Higher education institutions – – – – – – – – –
Foreign governments and international organisations – – – – – – – – –
Public corporations and private enterprises – – – – – – – – –
Public corporations – – – – – – – – –
Subsidies on production – – – – – – – – –
Other transfers – – – – – – – – –
Private enterprises – – – – – – – – –
Subsidies on production – – – – – – – – –
Other transfers – – – – – – – – –
Non-profit institutions 2 391 354 2 535 081 2 100 635 2 147 433 2 026 968 2 026 968 2 908 127 2 343 396 2 527 670 43.5
Households 180 498 196 841 222 067 152 807 152 807 181 179 159 530 166 693 174 161 (11.9)
Social benefits – – – – – – – – –
Other transfers to households 180 498 196 841 222 067 152 807 152 807 181 179 159 530 166 693 174 161 (11.9)
Payments for capital assets 5 390 4 213 1 809 1 106 1 109 1 106 10 278 11 165 11 665 829.3
Buildings and other fixed structures – 2 639 694 – – – 2 700 – –
Buildings – – – – – – – – –
Other fixed structures – 2 639 694 – – – 2 700 – –
Machinery and equipment 5 390 1 574 1 115 1 106 1 109 1 106 5 928 11 165 11 665 436.0
Transport equipment 2 807 – 927 1 106 – – 996 – –
Other machinery and equipment 2 583 1 574 188 – 1 109 1 106 4 932 11 165 11 665 345.9
Heritage Assets – – – – – – – – –
Specialised military assets – – – – – – – – –
Biological assets – – – – – – – – –
Land and sub-soil assets – – – – – – – – –
Software and other intangible assets – – – – – – 1 650 – –
Payments for financial assets – – – – – – – – –
Total economic classification 30 734 192 29 651 903 30 050 710 30 028 285 31 165 637 31 007 924 32 453 782 33 079 709 34 643 178 4.7
334