
Page 341 - Provincial Treasury Estimates.pdf
P. 341
Estimates of the Provincial Revenue and Expenditure (EPRE) – 2023/24 Financial Year
Tables 22 and 23 above depict summaries of payments and estimates of expenditure per sub-programme
and economic classification. Expenditure on agregate, increased from R811.895 million in 2019/20 to a
revised estimate amount of R1.014 billion in 2022/23. Similarly, 2023/24 allocation reflects a health
increase of 4.7 per cent due additional provision in the baseline.
Expenditure on Compensation of Employees increased from R382.240 million in 2019/20 to a revised
estimate of R447.832 million in 2022/23. Provision for 2023/24 and over the medium period reflects a
growing scenario due to additional funding provided for wage agreement and planned absorption of Grade
R Practitioners.
Goods and Services expenditure increased from R123.302 million in 2019/20 to a revised estimate of
R129.334 million in 2022/23. A significant provision as denoted by 29.6 per cent growth is made for
2023/24, as a result of increase funding for ECD norms and standards, which will enable the acquisition
of sufficient learning material and training services for practioners.
Expenditure on transfers and subsidies increased from R305.747 million in 2019/20 to a revised estimate
of R437.090 million in 2022/23. A growth in allocation in 2023/24 amounts to 0.7 per cent, and continues
to reflect a postive growth trends in the outer year, largely due to additional funding provided on norms
and standards funding support for Grade R learners attached to public ordinary schools.
Capital expenditure increased from R606 thousand in 2019/20 to a revised estimates of R661 thousand in
2022/23. In 2023/24, allocation increased significantly by 181.4 per cent from the revised estimate, due to
planned procurement of laptops and relevant working tools for officials that have recently moved over as
part of the function shift.
8.5.1 Service delivery measures
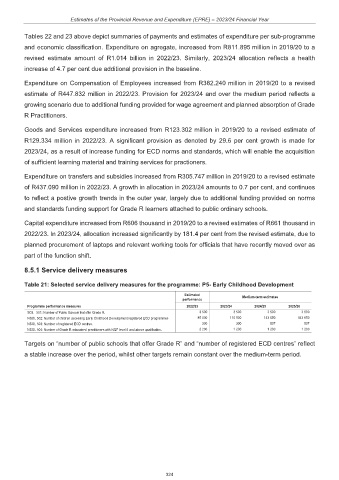
Table 21: Selected service delivery measures for the programme: P5- Early Childhood Development
Estimated Medium-term estimates
performance
Programme performance measures 2022/23 2023/24 2024/25 2025/26
SOI. 501: Number of Public Schools that offer Grade R. 3 500 3 500 3 500 3 500
NSOI. 502: Number of children accessing Early Childhood Development registered ECD programmes 85 000 110 500 143 650 143 650
NSOI. 503: Number of registered ECD centres. 300 390 507 507
NSOI. 504: Number of Grade R educators/ practitioners with NQF level 6 and above qualification. 2 200 1 200 1 200 1 200
Targets on “number of public schools that offer Grade R” and “number of registered ECD centres” reflect
a stable increase over the period, whilst other targets remain constant over the medium-term period.
324