
Page 338 - Provincial Treasury Estimates.pdf
P. 338
Department: Education
x Human Resource Development: To provide Departmental services for the development of
educators and non-educators in public special schools (including Inclusive education).
x School sport, culture and media services: To provide for Departmentally managed sporting,
cultural and reading activities in public special schools (including Inclusive education) and required
additional staff.
x Conditional Grants: To provide for projects under Programme 4 specified by the Department of
Basic Education and funded by conditional grants (including Inclusive education).
Table 19: Summary of payments and estimates by -programme: P4- Public Special School Education
Main Adjusted Revised
Outcome Medium-term estimates % change from
appropriation appropriation estimate
R thousand 2019/20 2020/21 2021/22 2022/23 2023/24 2024/25 2025/26 2022/23
1. Schools 806 122 869 018 920 535 996 434 1 002 889 1 002 889 1 072 064 1 179 582 1 254 485 6.9
2. Human Resource Development 1 061 – – 6 347 6 347 6 347 7 858 7 385 7 716 23.8
3. School Sport, Culture And Media Ser 4 419 841 16 7 920 7 920 7 920 9 738 13 255 13 850 23.0
4. Conditional Grants 18 117 26 237 23 925 28 333 32 800 32 800 29 070 30 232 31 173 (11.4)
Total payments and estimates 829 719 896 096 944 476 1 039 034 1 049 956 1 049 956 1 118 730 1 230 454 1 307 224 6.6
Table 20: Summary of payments and estimates by economic classification: P4- Public Special School
Education
Main Adjusted
Outcome Revised estimate Medium-term estimates % change from
appropriation appropriation
R thousand 2019/20 2020/21 2021/22 2022/23 2023/24 2024/25 2025/26 2022/23
Current payments 749 638 754 704 795 047 875 881 886 803 885 036 961 357 1 057 146 1 126 152 8.6
Compensation of employees 706 073 717 137 762 938 786 931 805 354 805 354 889 396 955 413 1 019 862 10.4
Goods and services 43 565 37 567 32 109 88 950 81 449 79 682 71 961 101 733 106 290 (9.7)
Interest and rent on land – – – – – – – – –
Transfers and subsidies to: 78 164 141 225 149 429 150 752 150 752 152 519 145 230 157 914 164 989 (4.8)
Provinces and municipalities – – – – – – – – –
Departmental agencies and accounts – – – – – – – – –
Higher education institutions – – – – – – – – –
Foreign governments and international organisations – – – – – – – – –
Public corporations and private enterprises – – – – – – – – –
Non-profit institutions 73 113 136 282 143 407 148 221 148 221 148 812 142 588 155 153 162 104 (4.2)
Households 5 051 4 943 6 022 2 531 2 531 3 707 2 642 2 761 2 885 (28.7)
Payments for capital assets 1 917 167 – 12 401 12 401 12 401 12 143 15 394 16 083 (2.1)
Buildings and other fixed structures 472 – – – – – – – –
Machinery and equipment 1 445 167 – 12 401 12 401 12 401 12 143 15 394 16 083 (2.1)
Heritage Assets – – – – – – – – –
Specialised military assets – – – – – – – – –
Biological assets – – – – – – – – –
Land and sub-soil assets – – – – – – – – –
Software and other intangible assets – – – – – – – – –
Payments for financial assets – – – – – – – – –
Total economic classification 829 719 896 096 944 476 1 039 034 1 049 956 1 049 956 1 118 730 1 230 454 1 307 224 6.6
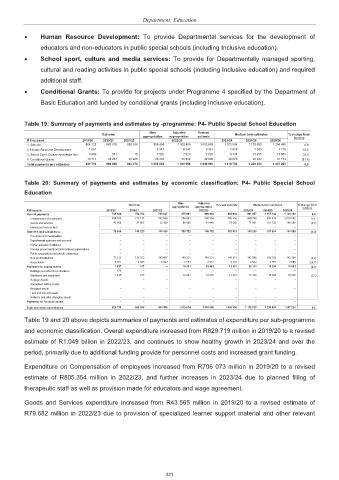
Table 19 and 20 above depicts summaries of payments and estimates of expenditure per sub-programme
and economic classification. Overall expenditure increased from R829.719 million in 2019/20 to a revised
estimate of R1.049 billion in 2022/23, and continues to show healthy growth in 2023/24 and over the
period, primarily due to additional funding provide for personnel costs and increased grant funding.
Expenditure on Compensation of employees increased from R706 073 million in 2019/20 to a revised
estimate of R805.354 million in 2022/23, and further increases in 2023/24 due to planned filling of
therapeutic staff as well as provision made for educators and wage agreement.
Goods and Services expenditure increased from R43.565 million in 2019/20 to a revised estimate of
R79.682 million in 2022/23 due to provision of specialized learner support material and other relevant
321