
Page 435 - Provincial Treasury Estimates.pdf
P. 435
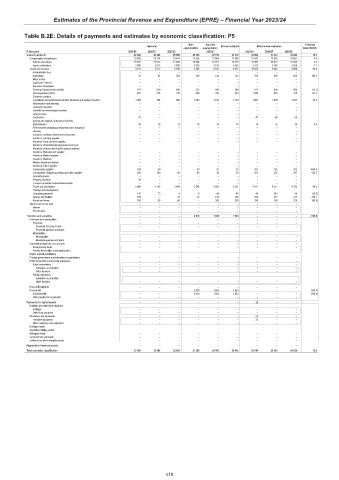
Estimates of the Provincial Revenue and Expenditure (EPRE) – Financial Year 2023/24
Table B.2E: Details of payments and estimates by economic classification: P5
Main Adjusted % change
Outcome Revised estimate Medium-term estimates
appropriation appropriation from 2022/23
R thousand 2019/20 2020/21 2021/22 2022/23 2023/24 2024/25 2025/26
Current payments 27 684 23 396 25 660 25 380 27 619 27 619 32 582 33 433 34 629 18.0
Compensation of employees 18 543 20 124 20 474 21 034 21 604 21 604 22 547 23 891 24 661 4.4
Salaries and wages 15 875 17 512 17 838 18 006 18 471 18 578 19 305 20 431 21 033 3.9
Social contributions 2 668 2 612 2 636 3 028 3 133 3 026 3 242 3 460 3 628 7.1
Goods and services 9 141 3 272 5 186 4 346 6 015 6 015 10 035 9 542 9 968 66.8
Administrative fees – – – – – – – – –
Advertising 33 61 303 140 120 120 358 480 600 198.3
Minor assets – – – – – – – – –
Audit cost: External – – – – – – – – –
Bursaries: Employees – – – – – – – – –
Catering: Departmental activities 747 219 540 372 590 588 517 639 650 (12.1)
Communication (G&S) 821 218 310 249 414 414 1 040 610 720 151.2
Computer services – – – – – – – – –
Consultants and professional services: Business and advisory services 1 368 764 988 1 090 1 100 1 100 1 963 1 989 2 043 78.5
Infrastructure and planning – – – – – – – – –
Laboratory services – – – – – – – – –
Scientific and technological services – – – – – – – – –
Legal services – – – – – – – – –
Contractors 70 – – – – – 47 80 80
Agency and support / outsourced services – – – – – – – – –
Entertainment 43 16 12 18 18 18 18 20 20 0.0
Fleet services (including government motor transport) – – – – – – – – –
Housing – – – – – – – – –
Inventory: Clothing material and accessories – – – – – – – – –
Inventory: Farming supplies – – – – – – – – –
Inventory: Food and food supplies – – – – – – – – –
Inventory: Chemicals,fuel,oil,gas,wood and coal – – – – – – – – –
Inventory: Learner and teacher support material – – – – – – – – –
Inventory: Materials and supplies – – – – – – – – –
Inventory: Medical supplies – – – – – – – – –
Inventory: Medicine – – – – – – – – –
Medsas inventory interface – – – – – – – – –
Inventory: Other supplies – – – – – – – – –
Consumable supplies 164 40 – 30 22 22 252 182 202 1045.5
Consumable: Stationery,printing and office supplies 236 100 80 65 30 30 205 227 297 583.3
Operating leases – – – – – – – – –
Property payments 10 – – – – – – – –
Transport provided: Departmental activity – – – – – – – – –
Travel and subsistence 5 080 1 743 2 844 2 340 3 205 3 207 4 761 4 577 4 765 48.5
Training and development – – – – – – – – –
Operating payments 115 73 4 9 48 48 40 361 54 (16.7)
Venues and facilities 198 – 45 33 138 138 704 217 217 410.1
Rental and hiring 256 38 60 – 330 330 130 160 320 (60.6)
Interest and rent on land – – – – – – – – –
Interest – – – – – – – – –
Rent on land – – – – – – – – –
Transfers and subsidies – – – 2 018 1 824 1 824 – – – (100.0)
Provinces and municipalities – – – – – – – – –
Provinces – – – – – – – – –
Provincial Revenue Funds – – – – – – – – –
Provincial agencies and funds – – – – – – – – –
Municipalities – – – – – – – – –
Municipalities – – – – – – – – –
Municipal agencies and funds – – – – – – – – –
Departmental agencies and accounts – – – – – – – – –
Social security funds – – – – – – – – –
Provide list of entities receiving transfers – – – – – – – – –
Higher education institutions – – – – – – – – –
Foreign governments and international organisations – – – – – – – – –
Public corporations and private enterprises – – – – – – – – –
Public corporations – – – – – – – – –
Subsidies on production – – – – – – – – –
Other transfers – – – – – – – – –
Private enterprises – – – – – – – – –
Subsidies on production – – – – – – – – –
Other transfers – – – – – – – – –
Non-profit institutions – – – – – – – – –
Households – – – 2 018 1 824 1 824 – – – (100.0)
Social benefits – – – 2 018 1 824 1 824 – – – (100.0)
Other transfers to households – – – – – – – – –
Payments for capital assets – – – – – – 32 – –
Buildings and other fixed structures – – – – – – – – –
Buildings – – – – – – – – –
Other fixed structures – – – – – – – – –
Machinery and equipment – – – – – – 32 – –
Transport equipment – – – – – – 32 – –
Other machinery and equipment – – – – – – – – –
Heritage Assets – – – – – – – – –
Specialised military assets – – – – – – – – –
Biological assets – – – – – – – – –
Land and sub-soil assets – – – – – – – – –
Software and other intangible assets – – – – – – – – –
Payments for financial assets – – – – – – – – –
Total economic classification 27 684 23 396 25 660 27 398 29 443 29 443 32 614 33 433 34 629 10.8
418