
Page 657 - Provincial Treasury Estimates.pdf
P. 657
Estimates of the Provincial Revenue and Expenditure (EPRE) – 2023/24 Financial Year
Table 10: Summary of departmental payments and estimates sub-programme: P1- Administration
Main Adjusted
Outcome Revised estimate Medium-term estimates % change
appropriation appropriation
R thousand 2019/20 2020/21 2021/22 2022/23 2023/24 2024/25 2025/26 from 2022/23
1. Office Of The MEC 7 482 7 140 6 913 7 640 7 507 7 507 7 796 8 244 8 574 3.8
2. Management Services 40 885 38 754 39 245 49 614 46 497 46 498 60 098 58 657 59 298 29.2
3. Corporate Services 45 708 42 215 44 358 48 487 51 230 51 561 61 474 66 022 73 251 19.2
4. Financial Management (Office Of The CFO) 51 733 50 129 50 533 55 677 55 835 55 835 56 048 59 294 61 862 0.4
5. Internal Audit 7 279 6 842 7 979 8 298 7 846 7 846 8 296 8 837 9 185 5.7
Total payments and estimates 153 087 145 080 149 028 169 716 168 915 169 247 193 712 201 054 212 170 14.5
Table 11: Summary of departmental payments and estimates by economic classification: P1 Administration
Main Adjusted
Outcome Revised estimate Medium-term estimates % change
appropriation appropriation from 2022/23
R thousand 2019/20 2020/21 2021/22 2022/23 2023/24 2024/25 2025/26
Current payments 146 830 138 129 141 659 155 122 157 148 157 473 178 308 187 810 199 988 13.2
Compensation of employees 110 039 110 133 111 493 115 068 115 030 115 030 115 017 122 142 126 809 (0.0)
Goods and services 36 791 27 996 30 166 40 054 42 118 42 443 63 291 65 668 73 179 49.1
Interest and rent on land – – – – – – – – –
Transfers and subsidies to: 1 729 2 261 1 685 1 702 3 052 3 059 1 778 1 859 1 944 (41.9)
Provinces and municipalities – – – – – – – – –
Departmental agencies and accounts 816 942 849 1 102 1 103 1 103 1 152 1 205 1 260 4.4
Higher education institutions – – – – – – – – –
Foreign governments and international organisations – – – – – – – – –
Public corporations and private enterprises – – – – – – – – –
Non-profit institutions – – – – – – – – –
Households 913 1 319 836 600 1 949 1 956 626 654 684 (68.0)
Payments for capital assets 4 528 4 514 5 361 12 892 8 715 8 715 13 626 11 385 10 238 56.4
Buildings and other fixed structures – – – – – – – – –
Machinery and equipment 4 492 4 514 5 361 12 892 8 715 8 715 13 626 11 385 10 238 56.4
Heritage Assets – – – – – – – – –
Specialised military assets – – – – – – – – –
Biological assets – – – – – – – – –
Land and sub-soil assets – – – – – – – – –
Software and other intangible assets 36 – – – – – – – –
Payments for financial assets – 176 323 – – – – – –
Total economic classification 153 087 145 080 149 028 169 716 168 915 169 247 193 712 201 054 212 170 14.5
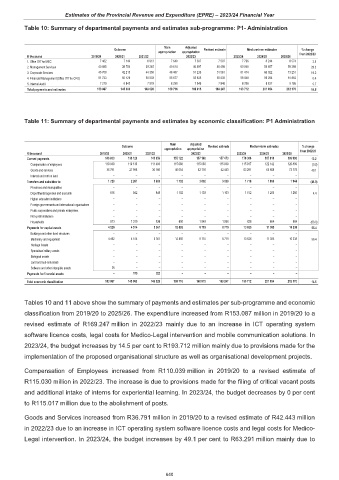
Tables 10 and 11 above show the summary of payments and estimates per sub-programme and economic
classification from 2019/20 to 2025/26. The expenditure increased from R153.087 million in 2019/20 to a
revised estimate of R169.247 million in 2022/23 mainly due to an increase in ICT operating system
software licence costs, legal costs for Medico-Legal intervention and mobile communication solutions. In
2023/24, the budget increases by 14.5 per cent to R193.712 million mainly due to provisions made for the
implementation of the proposed organisational structure as well as organisational development projects.
Compensation of Employees increased from R110.039 million in 2019/20 to a revised estimate of
R115.030 million in 2022/23. The increase is due to provisions made for the filing of critical vacant posts
and additional intake of interns for experiential learning. In 2023/24, the budget decreases by 0 per cent
to R115.017 million due to the abolishment of posts.
Goods and Services increased from R36.791 million in 2019/20 to a revised estimate of R42.443 million
in 2022/23 due to an increase in ICT operating system software licence costs and legal costs for Medico-
Legal intervention. In 2023/24, the budget increases by 49.1 per cent to R63.291 million mainly due to
640