
Page 652 - Provincial Treasury Estimates.pdf
P. 652
Provincial Treasury
Fund owing to allocation of surplus funds for provincial priorities. It is estimated that receipts will increase
gradually in the two outer years.
7. 7. Payment summary
7.1. Key assumptions
Assumptions and factors contained in the 2022 Medium-Term Budget Policy Statement (MTBPS), such
as living wage adjustments and cash gratuity for 2023/24 were taken into consideration. National and
provincial budget reductions as well as cost containment measures have been taken into account for the
entire 2023 MTEF.
7.2. Programme Summary
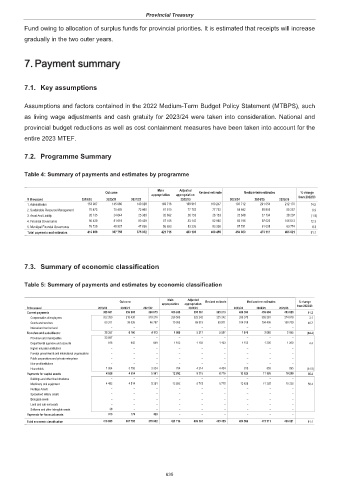
Table 4: Summary of payments and estimates by programme
Main Adjusted
Outcome Revised estimate Medium-term estimates % change
appropriation appropriation
R thousand 2019/20 2020/21 2021/22 2022/23 2023/24 2024/25 2025/26 from 2022/23
1. Administration 153 087 145 080 149 028 169 716 168 915 169 247 193 712 201 054 212 170 14.5
2. Sustainable Resource Management 70 473 70 485 73 460 81 510 77 752 77 752 84 642 86 805 85 257 8.9
3. Asset And Liability 26 135 24 644 25 369 26 692 26 153 26 153 25 648 27 134 28 207 (1.9)
4. Financial Governance 90 439 81 619 80 439 87 105 83 147 82 965 93 196 97 023 106 613 12.3
5. Municipal Financial Governance 76 725 45 927 47 636 56 693 53 226 53 338 57 791 61 095 63 774 8.3
Total payments and estimates 416 859 367 755 375 932 421 716 409 193 409 455 454 989 473 111 496 021 11.1
7.3. Summary of economic classification
Table 5: Summary of payments and estimates by economic classification
Main Adjusted
Outcome Revised estimate Medium-term estimates % change
appropriation appropriation
R thousand 2019/20 2020/21 2021/22 2022/23 2023/24 2024/25 2025/26 from 2022/23
Current payments 385 661 356 965 366 075 406 938 395 161 395 213 439 393 459 666 483 628 11.2
Compensation of employees 322 350 318 430 319 278 336 585 325 242 325 242 335 375 355 261 374 919 3.1
Goods and services 63 311 38 535 46 797 70 353 69 919 69 971 104 018 104 405 108 709 48.7
Interest and rent on land – – – – – – – – –
Transfers and subsidies to: 26 357 6 100 4 173 1 886 5 317 5 527 1 970 2 060 2 155 (64.4)
Provinces and municipalities 23 587 – – – – – – – –
Departmental agencies and accounts 816 942 849 1 102 1 103 1 103 1 152 1 205 1 260 4.4
Higher education institutions – – – – – – – – –
Foreign governments and international organisations – – – – – – – – –
Public corporations and private enterprises – – – – – – – – –
Non-profit institutions – – – – – – – – –
Households 1 954 5 158 3 324 784 4 214 4 424 818 855 895 (81.5)
Payments for capital assets 4 528 4 514 5 361 12 892 8 715 8 715 13 626 11 385 10 238 56.4
Buildings and other fixed structures – – – – – – – – –
Machinery and equipment 4 492 4 514 5 361 12 892 8 715 8 715 13 626 11 385 10 238 56.4
Heritage Assets – – – – – – – – –
Specialised military assets – – – – – – – – –
Biological assets – – – – – – – – –
Land and sub-soil assets – – – – – – – – –
Software and other intangible assets 36 – – – – – – – –
Payments for financial assets 313 176 323 – – – – – –
Total economic classification 416 859 367 755 375 932 421 716 409 193 409 455 454 989 473 111 496 021 11.1
635