Page 456 - Provincial Treasury Estimates.pdf
P. 456

Department: Rural Development and Agrarian Reform


           8. 8. Programme description


           8.1   Programme 1: Administration


           Objectives: To manage and formulate policy directives and priorities and, to ensure there is appropriate
           support service to all other programmes with regard to finance, personnel, information, communication
           and procurement. This programme is divided into 5 sub-programmes:
           x   Office of the MEC: To set priorities and political directives in order to meet the needs of clients.
               (For the efficient running of the MECs office).
           x   Senior Management: To translate policies and priorities into strategies for effective service delivery
               and, to manage, monitor and control performance;
           x   Corporate Services: To provide support service to  the other programmes with  regard to human
               resources management and development, Information Technology and Communication service;
           x   Financial Management: To provide effective support service (including monitoring and control) with
               regard to Budgeting, Provisioning and Procurement; and
           x   Communication Services: This sub-programme proposes  to focus on internal and external
               communications of the department through written, verbal, visual and electronic media as well as
               marketing and advertising of the departmental services.

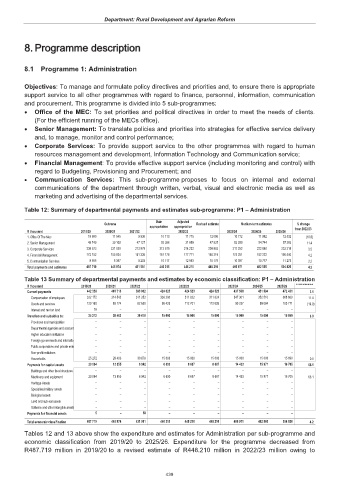
           Table 12: Summary of departmental payments and estimates sub-programme: P1 – Administration

                                                         Main    Adjusted
                                       Outcome                          Revised estimate  Medium-term estimates  % change
                                                       appropriation  appropriation                       from 2022/23
            R thousand         2019/20  2020/21  2021/22         2022/23          2023/24  2024/25  2025/26
            1. Office Of The Mec                   18 690                   11 545                     9 936                   10 113                   11 715                   12 096                   10 772                   11 982                   12 532  (10.9)
            2. Senior Management                   48 749                   39 109                   47 127                   52 388                   31 899                   47 837                   53 299                   54 744                   57 263  11.4
            3. Corporate Services                 238 573                 231 039                 213 979                 212 519                 214 232                 209 883                 217 252                 222 840                 233 218  3.5
            4. Financial Management                 173 152                 155 924                 151 336                 161 178                 177 771                 168 219                 175 251                 182 222                 190 540  4.2
            5. Communication Services                     8 555                     8 357                     9 203                   10 117                   12 593                   10 175                   10 397                   10 777                   11 273  2.2
            Total payments and estimates                 487 719                 445 974                 431 581                 446 315                 448 210                 448 210                 466 971                 482 565                 504 826  4.2

           Table 13 Summary of departmental payments and estimates by economic classification: P1 – Administration
            R thousand         2019/20  2020/21  2021/22          2022/23          2023/24  2024/25  2025/26  from 2022/23
            Current payments                 442 358                 403 716                 393 902                 424 625                 424 523                 424 523                 437 538                 451 594                 472 431  3.1
              Compensation of employees                  322 172                 314 542                 311 252                 338 200                 311 822                 311 824                 347 301                 352 510                 368 660  11.4
              Goods and services                  120 168                   89 174                   82 650                   86 425                 112 701                 112 699                   90 237                   99 084                 103 771  (19.9)
              Interest and rent on land                           18                            –                            –                            –                            –                            –                            –                            –                            –
            Transfers and subsidies to:                   25 272                   28 403                   30 678                   15 000                   15 000                   15 000                   15 000                   15 000                   15 690  0.0
              Provinces and municipalities                             –                            –                            –                            –                            –                            –                            –                            –                            –
              Departmental agencies and accounts                           –                            –                            –                            –                            –                            –                            –                            –                            –
              Higher education institutions                            –                            –                            –                            –                            –                            –                            –                            –                            –
              Foreign governments and internation                           –                            –                            –                            –                            –                            –                            –                            –                            –
              Public corporations and private ente                           –                            –                            –                            –                            –                            –                            –                            –                            –
              Non-profit institutions                            –                            –                            –                            –                            –                            –                            –                            –                            –
              Households                      25 272                   28 403                   30 678                   15 000                   15 000                   15 000                   15 000                   15 000                   15 690  0.0
            Payments for capital assets                   20 084                   13 855                     6 942                     6 690                     8 687                     8 687                   14 433                   15 971                   16 705  66.1
              Buildings and other fixed structures                           –                            –                            –                            –                            –                            –                            –                            –                            –
              Machinery and equipment                   20 084                   13 855                     6 942                     6 690                     8 687                     8 687                   14 433                   15 971                   16 705  66.1
              Heritage Assets                            –                            –                            –                            –                            –                            –                            –                            –                            –
              Specialised military assets                            –                            –                            –                            –                            –                            –                            –                            –                            –
              Biological assets                            –                            –                            –                            –                            –                            –                            –                            –                            –
              Land and sub-soil assets                            –                            –                            –                            –                            –                            –                            –                            –                            –
              Software and other intangible assets                           –                            –                            –                            –                            –                            –                            –                            –                            –
            Payments for financial assets                            5                            –                          59                            –                            –                            –                            –                            –                            –
            Total economic classification                 487 719                 445 974                 431 581                 446 315                 448 210                 448 210                 466 971                 482 565                 504 826  4.2
           Tables 12 and 13 above show the expenditure and estimates for Administration per sub-programme and
           economic classification from 2019/20 to 2025/26. Expenditure  for the programme decreased from
           R487.719 million in 2019/20 to a revised estimate of R448.210 million in 2022/23  million owing to


                                                             439
   451   452   453   454   455   456   457   458   459   460   461