
Page 451 - Provincial Treasury Estimates.pdf
P. 451
Estimates of the Provincial Revenue and Expenditure (EPRE) – 2023/24 Financial Year
7.3 Summary of economic classification
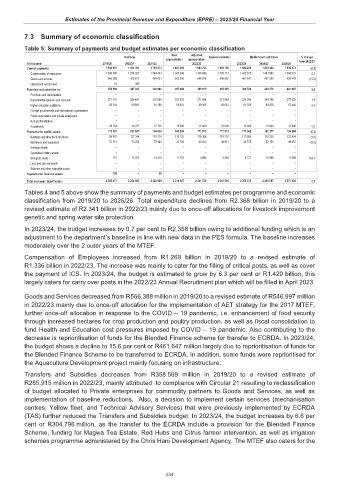
Table 5: Summary of payments and budget estimates per economic classification
Main Adjusted
Outcome Revised estimate Medium-term estimates % change
appropriation appropriation
R thousand 2019/20 2020/21 2021/22 2022/23 2023/24 2024/25 2025/26 from 2022/23
Current payments 1 835 901 1 664 703 1 718 874 1 897 699 1 883 705 1 883 709 1 882 220 1 849 432 1 935 173 (0.1)
Compensation of employees 1 269 495 1 234 327 1 249 443 1 395 349 1 336 889 1 336 712 1 420 573 1 441 882 1 506 731 6.3
Goods and services 566 388 429 877 469 431 502 350 546 816 546 997 461 647 407 550 428 442 (15.6)
Interest and rent on land 18 499 – – – – – – –
Transfers and subsidies to: 358 569 347 033 330 961 257 684 285 915 285 915 304 796 428 278 441 067 6.6
Provinces and municipalities – – – – – – – – –
Departmental agencies and accounts 271 101 256 481 232 608 183 633 211 864 211 864 228 088 348 799 357 932 7.7
Higher education institutions 58 704 59 801 61 198 59 051 59 051 59 051 61 708 64 479 67 445 4.5
Foreign governments and international organisations – – – – – – – – –
Public corporations and private enterprises – – – – – – – – –
Non-profit institutions – – – – – – – – –
Households 28 764 30 751 37 155 15 000 15 000 15 000 15 000 15 000 15 690 0.0
Payments for capital assets 173 207 222 847 195 026 163 564 171 910 171 912 171 360 182 377 194 864 (0.3)
Buildings and other fixed structures 99 981 137 344 110 114 119 133 119 106 119 107 117 898 119 338 133 804 (1.0)
Machinery and equipment 73 111 70 252 70 493 32 729 48 910 48 911 44 735 52 150 49 672 (8.5)
Heritage Assets – – – – – – – – –
Specialised military assets – – – – – – – – –
Biological assets 115 15 251 14 419 11 702 3 894 3 894 8 727 10 889 11 388 124.1
Land and sub-soil assets – – – – – – – – –
Software and other intangible assets – – – – – – – – –
Payments for financial assets 795 – 59 – – – – – –
Total economic classification 2 368 471 2 234 583 2 244 920 2 318 947 2 341 530 2 341 536 2 358 376 2 460 087 2 571 104 0.7
Tables 4 and 5 above show the summary of payments and budget estimates per programme and economic
classification from 2019/20 to 2025/26. Total expenditure declines from R2.368 billion in 2019/20 to a
revised estimate of R2.341 billion in 2022/23 mainly due to once-off allocations for livestock improvement
genetic and spring water site protection.
In 2023/24, the budget increases by 0.7 per cent to R2.358 billion owing to additional funding which is an
adjustment to the department’s baseline in line with new data in the PES formula. The baseline increases
moderately over the 2 outer years of the MTEF.
Compensation of Employees increased from R1.269 billion in 2019/20 to a revised estimate of
R1.336 billion in 2022/23. The increase was mainly to cater for the filling of critical posts, as well as cover
the payment of ICS. In 2023/24, the budget is estimated to grow by 6.3 per cent or R1.420 billion, this
largely caters for carry over posts in the 2022/23 Annual Recruitment plan which will be filled in April 2023.
Goods and Services decreased from R566.388 million in 2019/20 to a revised estimate of R546.997 million
in 2022/23 mainly due to once-off allocation for the implementation of AET strategy for the 2017 MTEF,
further once-off allocation in response to the COVID – 19 pandemic, i.e. enhancement of food security
through increased hectares for crop production and poultry production, as well as fiscal consolidation to
fund Health and Education cost pressures imposed by COVID – 19 pandemic. Also contributing to the
decrease is reprioritisation of funds for the Blended Finance scheme for transfer to ECRDA. In 2023/24,
the budget shows a decline to 15.6 per cent or R461.647 million largely due to reprioritisation of funds for
the Blended Finance Scheme to be transferred to ECRDA. In addition, some funds were reprioritised for
the Aquaculture Development project mainly focusing on infrastructure.
Transfers and Subsidies decreases from R358.569 million in 2019/20 to a revised estimate of
R285.915 million in 2022/23, mainly attributed to compliance with Circular 21 resulting to reclassification
of budget allocated to Private enterprises for commodity partners to Goods and Services, as well as
implementation of baseline reductions. Also, a decision to implement certain services (mechanisation
centres, Yellow fleet, and Technical Advisory Services) that were previously implemented by ECRDA
(TAS) further reduced the Transfers and Subsidies budget. In 2023/24, the budget increases by 6.6 per
cent or R304.796 million, as the transfer to the ECRDA include a provision for the Blended Finance
Scheme, funding for Magwa Tea Estate, Red Hubs and Citrus farmer intervention, as well as irrigation
schemes programme administered by the Chris Hani Development Agency. The MTEF also caters for the
434