Page 453 - Provincial Treasury Estimates.pdf
P. 453

Estimates of the Provincial Revenue and Expenditure (EPRE) – 2023/24 Financial Year

           7.4  Expenditure by municipal boundary

           Table 6: Summary of departmental payments and estimates by benefiting municipal boundary
                                                              Main   Adjusted                           % change
                                               Outcome                     Revised estimate  Medium-term estimates
                                                            appropriation  appropriation               from 2022/23
           R thousand                   2019/20  2020/21  2021/22    2022/23        2023/24  2024/25  2025/26
             Buffalo City                                    414                      1 623                    54 428                    54 428                    54 428                      7 606                    68 424                    75 714            81 237  799.6
             Nelson Mandela Bay                                  –                      1 035                             –                             –                             –                      1 838                             –                             –                     –  (100.0)
            Sarah Baartman District Municipality                      1 299                    16 423                    50 139                    44 983                    50 139                    14 966                    53 072                    55 455            57 939  254.6
              Dr Beyers Naude                                408                      2 789                      5 156  `                      5 156                      4 482                      5 457                      5 702              5 957  21.8
              Blue Crane Route                                 35                      3 719                      2 262                      2 262                      2 262                      2 783                      2 395                      2 503              2 615  (13.9)
              Makana                                         336                      3 500                         661                         661                         661                      2 139                         700                         731                 764  (67.3)
              Ndlambe                                        520                         786                      3 263                      3 263                      3 263                      2 059                      3 454                      3 609              3 771  67.8
              Sundays River Valley                               –                      5 629                      1 454                      1 454                      1 454                      1 736                      1 539                      1 608              1 680  (11.3)
              Kouga                                              –                             –                      1 719                      1 719                      1 719                      1 267                      1 820                      1 902              1 987  43.6
              Kou-Kamma                                          –                             –                    35 624                    35 624                    35 624                         500                    37 707                    39 400            41 165  7441.4
            Amatole District Municipality                    36 282                    30 739                  102 120                  102 120                  102 120                    57 227                  108 091                  112 943          118 003  88.9
              Mbhashe                                     6 925                      3 754                      6 427                      6 427                      6 427                    14 044                      6 802                      7 107              7 425  (51.6)
              Mnquma                                    11 192                      4 703                    13 616                    13 616                    13 616                    18 201                    14 413                    15 060            15 735  (20.8)
              Great Kei                                      821                         802                      1 114                      1 114                      1 114                      2 725                      1 179                      1 232              1 287  (56.7)
              Amahlathi                                   2 997                      3 744                      6 550                      6 550                      6 550                      3 991                      6 933                      7 244              7 569  73.7
              Ngqushwa                                    9 978                    11 500                    69 501                    69 501                    69 501                    12 887                    73 565                    76 868            80 312  470.8
              Raymond Mhlaba                              4 369                      6 236                      4 912                      4 912                      4 912                      5 379                      5 199                      5 432              5 675  (3.3)
            Chris Hani District Municipality                    38 285                    31 011                    45 844                    45 844                    45 844                    50 328                    48 526                    50 706            52 977  (3.6)
              Inxuba Yethemba                                    –                         686                      3 601                      3 601                      3 601                      8 969                      3 812                      3 983              4 161  (57.5)
              Intsika Yethu                               8 507                      9 353                    15 983                    15 983                    15 983                    10 365                    16 918                    17 678            18 470  63.2
              Emalahleni                                  2 837                      1 302                    13 017                    13 017                    13 017                      7 188                    13 778                    14 397            15 042  91.7
              Engcobo                                   11 679                      5 945                      3 700                      3 700                      3 700                      8 015                      3 917                      4 093              4 276  (51.1)
              Sakhisizwe                                  7 172                    11 386                      7 460                      7 460                      7 460                      8 631                      7 896                      8 251              8 621  (8.5)
              Enoch Mgijima                               8 090                      2 339                      2 083                      2 083                      2 083                      7 160                      2 205                      2 304              2 407  (69.2)
            Joe Gqabi District Municipality                    16 101                    20 576                      5 406                      5 406                      5 406                    35 767                      5 722                      5 979              6 247  (84.0)
              Elundini                                    6 622                      7 340                      1 003                      1 003                      1 003                    18 429                      1 062                      1 110              1 160  (94.2)
              Senqu                                       4 871                      6 322                      1 669                      1 669                      1 669                      9 343                      1 766                      1 845              1 928  (81.1)
              Walter Sisulu                               4 608                      6 914                      2 734                      2 734                      2 734                      7 995                      2 894                      3 024              3 159  (63.8)
            O.R. Tambo District Municipality                    37 813                    32 309                    70 400                    70 400                    70 400                    54 865                   74 517                    77 862            81 351  35.8
              Ngquza Hill                                 4 572                      4 692                      9 012                      9 012                      9 012                      5 982                      9 539                      9 967            10 414  59.5
              Port St Johns                               4 005                      6 973                             –                             –                             –                      7 842                             –                             –                     –  (100.0)
              Nyandeni                                    6 111                      8 120                      3 099                      3 099                      3 099                      7 669                      3 280                      3 427              3 581  (57.2)
              Mhlontlo                                    1 602                      3 785                             –                             –                             –                      8 639                             –                             –                     –  (100.0)
              King Sabata Dalindyebo                    21 523                      8 739                    58 289                    58 289                    58 289                    24 733                    61 698                    64 468            67 356  149.5
            Alfred Nzo District Municipality                    18 447                    33 743                    70 747                    70 747                    70 747                    22 127                    64 884                    67 797            70 835  193.2
              Matatiele                                   5 974                      6 282                    47 076                    47 076                    47 076                      5 911                    49 829                    52 066            54 399  743.0
              Umzimvubu                                   5 158                    13 349                      9 829                      9 829                      9 829                      6 201                    10 404                    10 871            11 358  67.8
              Mbizana                                     4 492                      9 519                    10 966                    10 966                    10 966                      3 734                      1 607                      1 679              1 754  (57.0)
              Ntabankulu                                  2 823                      4 593                      2 876                      2 876                      2 876                      6 281                      3 044                      3 181              3 324  (51.5)
            District Municipalities                1 093 491               1 075 713               1 279 750               1 279 750               1 279 750               1 341 178               1 441 047               1 505 750       1 573 208  7.4
             Sarah Baartman District Municipality                  132 560                  106 041                  121 143                  121 143                  121 143                  126 837                  128 105                  133 857          139 854  1.0
             Amatole District Municipality                  296 147                  284 806                  318 144                  318 144                  318 144                  333 097                  336 428                  351 534          367 283  1.0
             Chris Hani District Municipality                  167 230                  189 018                  223 189                  223 189                  223 189                  233 679                  236 016                  246 613          257 661  1.0
             Joe Gqabi District Municipality                    95 029                    97 397                  135 112                  135 112                  135 112                  142 562                  143 988                  150 453          157 193  1.0
             O.R. Tambo District Municipality                  244 833                  246 223                  301 947                  301 947                  301 947                  316 139                  319 301                  333 637          348 584  1.0
             Alfred Nzo District Municipality                  157 692                  152 228                  180 215                  180 215                  180 215                  188 864                  277 209                  289 656          302 633  46.8
            Unallocated                            1 126 339                  991 411                  566 086                  645 269                  662 696                  755 634                  494 093                  507 881          529 307  (34.6)
           Total Payments                          2 368 471               2 234 583               2 244 920               2 318 947               2 341 530               2 341 536               2 358 376               2 460 087       2 571 104  0.7
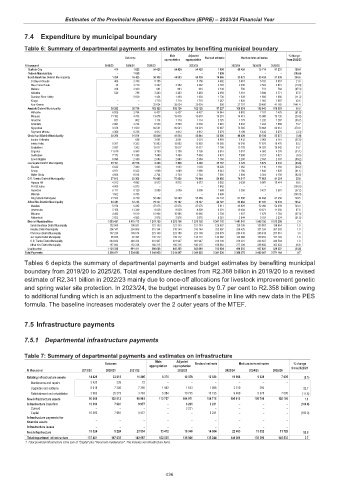
           Tables 6 depicts the summary of departmental payments and budget estimates by benefiting municipal
           boundary from 2019/20 to 2025/26. Total expenditure declines from R2.368 billion in 2019/20 to a revised
           estimate of R2.341 billion in 2022/23 mainly due to once-off allocations for livestock improvement genetic
           and spring water site protection. In 2023/24, the budget increases by 0.7 per cent to R2.358 billion owing
           to additional funding which is an adjustment to the department’s baseline in line with new data in the PES
           formula. The baseline increases moderately over the 2 outer years of the MTEF.

           7.5  Infrastructure payments

           7.5.1  Departmental infrastructure payments

           Table 7: Summary of departmental payments and estimates on infrastructure
                                                         Main    Adjusted
                                        Outcome                        Revised estimate  Medium-term estimates  % change
                                                       appropriation  appropriation
            R thousand         2019/20  2020/21  2021/22         2022/23          2023/24  2024/25  2025/26  from 2022/23
            Existing infrastructure assets                    14 429                    33 818                    11 205                      8 376                    12 378                    12 633                    11 988                      9 628                      7 605  (5.1)
              Maintenance and repairs                       3 428                         339                           72                             –                             –                             –                             –                             –                             –
              Upgrades and additions                      8 018                      7 206                      7 350                      1 992                      1 643                      1 898                      2 519                         250                             –  32.7
              Refurbishment and rehabilitation                      2 983                    26 273                      3 783                      6 384                    10 735                    10 735                      9 469                      9 378                      7 605  (11.8)
            New infrastructure assets                    90 668                  120 612                    98 981                  110 757                  104 971                  104 716                  105 910                  109 710                  126 199  1.1
            Infrastructure transfers                    16 360                      7 981                      9 977                             –                      3 231                      3 231                             –                             –                             –  (100.0)
              Current                                    –                             –                             –                             –                      3 231                             –                             –                             –                             –
              Capital                           16 360                      7 981                      9 977                             –                             –                      3 231                             –                             –                             –  (100.0)
            Infrastructure payments for                             –                               –                             –                             –                             –                             –                             –                             –                             –
            financial assets
            Infrastructure leases                             –                             –                             –                             –                             –                             –                             –                             –                             –
            Non infrastructure                    16 024                      5 224                    23 534                    13 472                    16 346                    14 664                    22 403                    19 052                    11 729  52.8
            Total department infrastructure                  137 481                  167 635                  143 697                  132 605                  136 926                  135 244                  140 301                  138 390                  145 533  3.7
            1. Total provincial infrastructure is the sum of "Capital" plus "Recurrent maintenance". This includes non infrastructure items.


                                                             436
   448   449   450   451   452   453   454   455   456   457   458