Page 484 - Provincial Treasury Estimates.pdf
P. 484

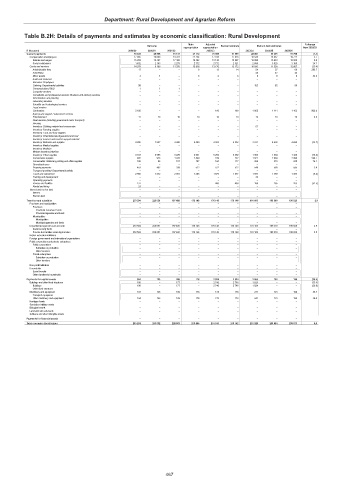
Department: Rural Development and Agrarian Reform

           Table B.2H: Details of payments and estimates by economic classification: Rural Development

                                                      Outcome        Main   Adjusted   Revised estimate  Medium-term estimates  % change
                                                                   appropriation  appropriation              from 2022/23
            R thousand                          2019/20  2020/21  2021/22  2022/23       2023/24  2024/25  2025/26
            Current payments                      31 463  26 858  31 137  37 170  31 088  31 090  28 681  30 405  31 788  (7.7)
             Compensation of employees            17 085  18 660  19 761  21 254  17 918  17 918  18 588  18 867  19 721  3.7
              Salaries and wages                  15 253  16 497  17 486  18 482  15 146  15 597  15 693  15 842  16 556  0.6
              Social contributions                1 832  2 163  2 275  2 772  2 772  2 321  2 895  3 025  3 165  24.7
             Goods and services                   14 378  8 198  11 376  15 916  13 170  13 172  10 093  11 538  12 067  (23.4)
              Administrative fees                  17      –     –      6      13     14    54     57     60    285.7
              Advertising                           –      –     –      –      –      –     40     42       44
              Minor assets                          2      4     –      6      6      6      8      8      8     33.3
              Audit cost: External                  –      –     –      –      –      –      –      –      –
              Bursaries: Employees                  –      –     –      –      –      –      –      –      –
              Catering: Departmental activities    58      –     –      –      –      –     152    82       86
              Communication (G&S)                   1      1     1      –      –      –      –      –      –
              Computer services                     –      –     –      –      –      –      –      –      –
              Consultants and professional services: Business and advisory services  –  –  –  –  –  –  –  –  –
              Infrastructure and planning           –      –     –      –      –      –      –      –      –
              Laboratory services                   –      –     –      –      –      –      –      –      –
              Scientific and technological services  –     –     –      –      –      –      –      –      –
              Legal services                        –      –     –      –      –      –      –      –      –
              Contractors                         2 185    –     –      –     100    100   1 063  1 111  1 162  963.0
              Agency and support / outsourced services  –  –     –      –      –      –      –      –      –
              Entertainment                        11     10     10     10     10     10    10     10     10     0.0
              Fleet services (including government motor transport)  –  –  –  –  –    –      –      –      –
              Housing                               –      –     –      –      –      –      –      –      –
              Inventory: Clothing material and accessories  –  –  –     –      –      –     67      –      –
              Inventory: Farming supplies           –      –     –      –      –      –      –      –      –
              Inventory: Food and food supplies     –      –     –      –      –      –      –      –      –
              Inventory: Chemicals,fuel,oil,gas,wood and coal  –  –  –  –      –      –      –      –      –
              Inventory: Learner and teacher support material  –  –  –  –      –      –      –      –      –
              Inventory: Materials and supplies   4 095  1 887  4 405  8 009  4 802  4 802  3 231  4 492  4 699  (32.7)
              Inventory: Medical supplies           –      –     –      –      –      –      –      –      –
              Inventory: Medicine                   –      –     –      –      –      –      –      –      –
              Medsas inventory interface            –      –     –      –      –      –      –      –      –
              Inventory: Other supplies           3 747  3 553  3 225  4 031  5 292  5 292  1 304  1 364  1 426  (75.4)
              Consumable supplies                  902    913   1 328  1 839  189    232   1 621  2 004  2 096  598.7
              Consumable: Stationery,printing and office supplies  186  96  107  197  160  117  206  215  225    76.1
              Operating leases                      –      –     –      –      –      –      –      –      –
              Property payments                    453    462    299   522    522    522    540    569    595    3.4
              Transport provided: Departmental activity  –  –    –      –      –      –      –      –      –
              Travel and subsistence              2 560  1 272  2 001  1 296  1 676  1 677  1 587  1 389  1 453  (5.4)
              Training and development              –      –     –      –      –      –     20      –      –
              Operating payments                    –      –     –      –      –      –      –      –      –
              Venues and facilities                137     –     –      –     400    400    190    195    203   (52.5)
              Rental and hiring                    24      –     –      –      –      –      –      –      –
             Interest and rent on land              –      –     –      –      –      –      –      –      –
              Interest                              –      –     –      –      –      –      –      –      –
              Rent on land                          –      –     –      –      –      –      –      –      –
            Transfers and subsidies                           253 504                  226 051                  197 480                  176 148                  176 148                  176 148                  181 183                  189 318                  198 026  2.9
             Provinces and municipalities           –      –     –      –      –      –      –      –      –
              Provinces                             –      –     –      –      –      –      –      –      –
               Provincial Revenue Funds             –      –     –      –      –      –      –      –      –
               Provincial agencies and funds        –      –     –      –      –      –      –      –      –
              Municipalities                        –      –     –      –      –      –      –      –      –
               Municipalities                       –      –     –      –      –      –      –      –      –
               Municipal agencies and funds         –      –     –      –      –      –      –      –      –
             Departmental agencies and accounts                  253 504                  226 051                  197 480                  176 148                  176 148                  176 148                  181 183                  189 318                  198 026  2.9
              Social security funds                 –      –     –      –      –      –      –      –      –
              Provide list of entities receiving transfers                  253 504                  226 051                  197 480                  176 148                  176 148                  176 148                  181 183                  189 318                  198 026  2.9
             Higher education institutions          –      –     –      –      –      –      –      –      –
             Foreign governments and international organisations  –  –  –  –   –      –      –      –      –
             Public corporations and private enterprises  –  –   –      –      –      –      –      –      –
              Public corporations                   –      –     –      –      –      –      –      –      –
               Subsidies on production              –      –     –      –      –      –      –      –      –
               Other transfers                      –      –     –      –      –      –      –      –      –
              Private enterprises                   –      –     –      –      –      –      –      –      –
               Subsidies on production              –      –     –      –      –      –      –      –      –
               Other transfers                      –      –     –      –      –      –      –      –      –
             Non-profit institutions                –      –     –      –      –      –      –      –      –
             Households                             –      –     –      –      –      –      –      –      –
              Social benefits                       –      –     –      –      –      –      –      –      –
              Other transfers to households         –      –     –      –      –      –      –      –      –
            Payments for capital assets            324    123    286   178    2 924  2 924  2 065  191    199   (29.4)
             Buildings and other fixed structures  190     –     177    –     2 746  2 746  1 824   –      –    (33.6)
              Buildings                            190     –     177    –     2 746  2 746  1 824   –      –    (33.6)
              Other fixed structures                –      –     –      –      –      –      –      –      –
             Machinery and equipment               134    123    109   178    178    178    241    191    199    35.4
              Transport equipment                   –      –     –      –      –      –      –      –      –
              Other machinery and equipment        134    123    109   178    178    178    241    191    199    35.4
             Heritage Assets                        –      –     –      –      –      –      –      –      –
             Specialised military assets            –      –     –      –      –      –      –      –      –
             Biological assets                      –      –     –      –      –      –      –      –      –
             Land and sub-soil assets               –      –     –      –      –      –      –      –      –
             Software and other intangible assets   –      –     –      –      –      –      –      –      –
            Payments for financial assets           –      –     –      –      –      –      –      –      –
            Total economic classification                     285 291                  253 032                  228 903                  213 496                  210 160                  210 162                  211 929                  219 914                  230 013  0.8


                                                             467
   479   480   481   482   483   484   485   486   487   488   489