
Page 486 - Provincial Treasury Estimates.pdf
P. 486
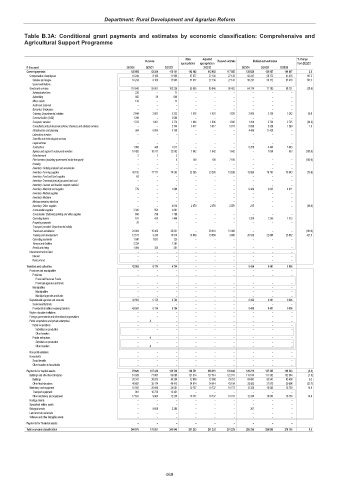
Department: Rural Development and Agrarian Reform
Table B.3A: Conditional grant payments and estimates by economic classification: Comprehensive and
Agricultural Support Programme
Main Adjusted % change
Outcome Revised estimate Medium-term estimates
appropriation appropriation from 2022/23
R thousand 2019/20 2020/21 2021/22 2022/23 2023/24 2024/25 2025/26
Current payments 120 892 63 241 115 141 112 982 112 982 117 585 120 621 129 957 119 607 2.6
Compensation of employees 10 244 8 180 11 905 57 077 27 136 27 133 56 247 58 772 61 476 107.3
Salaries and wages 10 244 8 180 11 905 57 077 27 136 27 133 56 247 58 772 61 476 107.3
Social contributions – – – – – – – – –
Goods and services 110 648 55 061 103 236 55 905 85 846 90 452 64 374 71 185 58 131 (28.8)
Administrative fees 226 – 71 – – – – – –
Advertising 802 30 648 – – – – – –
Minor assets 133 – 12 – – – – – –
Audit cost: External – – – – – – – – –
Bursaries: Employees – – – – – – – – –
Catering: Departmental activities 2 649 2 601 5 322 1 876 1 876 1 876 3 000 3 138 3 282 59.9
Communication (G&S) 1 209 – 3 660 – – – – – –
Computer services 1 723 1 061 2 774 1 836 1 836 1 836 1 200 2 720 2 725 (34.6)
Consultants and professional services: Business and advisory services – – 2 704 5 017 5 017 5 017 5 099 5 328 1 569 1.6
Infrastructure and planning 384 6 885 3 158 – – – 4 486 11 428 –
Laboratory services – – – – – – – – –
Scientific and technological services – – – – – – – – –
Legal services – – – – – – – – –
Contractors 1 068 348 1 617 – – – 5 256 3 445 3 603
Agency and support / outsourced services 10 492 10 571 12 582 1 642 1 642 1 642 – 1 054 953 (100.0)
Entertainment 2 2 2 – – – – – –
Fleet services (including government motor transport) – – 4 100 100 7 100 – – – (100.0)
Housing – – – – – – – – –
Inventory: Clothing material and accessories – – – – – – – – –
Inventory: Farming supplies 43 192 11 171 14 263 23 505 23 505 15 536 13 890 16 102 16 843 (10.6)
Inventory: Food and food supplies 63 – – – – – – – –
Inventory: Chemicals,fuel,oil,gas,wood and coal – – – – – – – – –
Inventory: Learner and teacher support material – – – – – – – – –
Inventory: Materials and supplies 779 – 1 896 – – – 9 489 3 835 4 011
Inventory: Medical supplies – – – – – – – – –
Inventory: Medicine – – – – – – – – –
Medsas inventory interface – – – – – – – – –
Inventory: Other supplies – – 4 014 2 070 2 070 2 070 215 – – (89.6)
Consumable supplies 3 320 554 2 881 – – – – – –
Consumable: Stationery,printing and office supplies 840 798 1 198 – – – – – –
Operating leases 181 433 1 446 – – – 1 200 1 255 1 313
Property payments 76 – – – – – – – –
Transport provided: Departmental activity – – – – – – – – –
Travel and subsistence 24 984 15 403 33 051 – 29 941 51 480 – – – (100.0)
Training and development 12 517 3 243 10 316 19 859 19 859 3 895 20 539 22 880 23 832 427.3
Operating payments 1 590 1 637 125 – – – – – –
Venues and facilities 3 334 – 1 291 – – – – – –
Rental and hiring 1 084 324 201 – – – – – –
Interest and rent on land – – – – – – – – –
Interest – – – – – – – – –
Rent on land – – – – – – – – –
Transfers and subsidies 43 563 6 174 6 764 – – – 8 496 9 481 9 906
Provinces and municipalities – – – – – – – – –
Provinces – – – – – – – – –
Provincial Revenue Funds – – – – – – – – –
Provincial agencies and funds – – – – – – – – –
Municipalities – – – – – – – – –
Municipalities – – – – – – – – –
Municipal agencies and funds – – – – – – – – –
Departmental agencies and accounts 43 563 6 174 6 764 – – – 8 496 9 481 9 906
Social security funds – – – – – – – – –
Provide list of entities receiving transfers 43 563 6 174 6 764 – – – 8 496 9 481 9 906
Higher education institutions – – – – – – – – –
Foreign governments and international organisations – – – – – – – – –
Public corporations and private enterprises – -0 – – – – – – –
Public corporations – – – – – – – – –
Subsidies on production – – – – – – – – –
Other transfers – – – – – – – – –
Private enterprises – -0 – – – – – – –
Subsidies on production – – – – – – – – –
Other transfers – -0 – – – – – – –
Non-profit institutions – – – – – – – – –
Households – – – – – – – – –
Social benefits – – – – – – – – –
Other transfers to households – – – – – – – – –
Payments for capital assets 79 620 107 446 121 740 138 251 138 251 133 648 126 219 127 365 149 243 (5.6)
Buildings and other fixed structures 61 028 77 087 93 699 127 514 127 514 122 911 113 574 111 362 132 504 (7.6)
Buildings 20 347 38 913 44 284 72 900 72 900 79 757 84 691 83 547 93 408 6.2
Other fixed structures 40 681 38 174 49 415 54 614 54 614 43 154 28 883 27 815 39 096 (33.1)
Machinery and equipment 18 592 20 690 24 661 10 737 10 737 10 737 12 338 16 003 16 739 14.9
Transport equipment 961 10 725 12 431 – – – – – –
Other machinery and equipment 17 631 9 965 12 230 10 737 10 737 10 737 12 338 16 003 16 739 14.9
Heritage Assets – – – – – – – – –
Specialised military assets – – – – – – – – –
Biological assets – 9 669 3 380 – – – 307 – –
Land and sub-soil assets – – – – – – – – –
Software and other intangible assets – – – – – – – – –
Payments for financial assets – – – – – – – – –
Total economic classification 244 075 176 861 243 645 251 233 251 233 251 233 255 336 266 803 278 756 1.6
469