
Page 488 - Provincial Treasury Estimates.pdf
P. 488
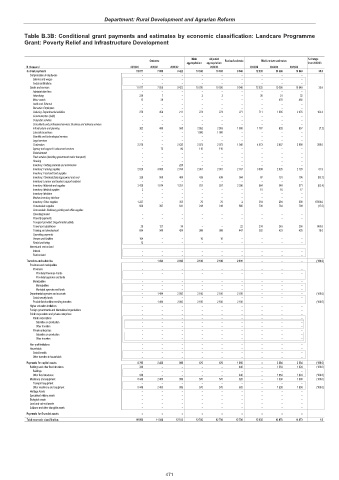
Department: Rural Development and Agrarian Reform
Table B.3B: Conditional grant payments and estimates by economic classification: Landcare Programme
Grant: Poverty Relief and Infrastructure Development
Main Adjusted % change
Outcome Revised estimate Medium-term estimates
appropriation appropriation from 2022/23
R thousand 2019/20 2020/21 2021/22 2022/23 2023/24 2024/25 2025/26
Current payments 11 071 7 859 9 422 10 030 10 030 9 540 12 935 10 386 10 849 35.6
Compensation of employees – – – – – – – – –
Salaries and wages – – – – – – – – –
Social contributions – – – – – – – – –
Goods and services 11 071 7 859 9 422 10 030 10 030 9 540 12 935 10 386 10 849 35.6
Administrative fees – – – – – – – – –
Advertising 229 7 – 3 3 – 30 31 32
Minor assets 13 29 – – – – – 470 492
Audit cost: External – – – – – – – – –
Bursaries: Employees – – – – – – – – –
Catering: Departmental activities 279 459 211 274 274 271 711 1 985 2 076 162.4
Communication (G&S) – – – – – – – – –
Computer services – – – – – – – – –
Consultants and professional services: Business and advisory services – – – – – – – – –
Infrastructure and planning 302 498 500 2 053 2 053 1 808 1 787 628 657 (1.2)
Laboratory services – – – 1 000 1 000 – – – –
Scientific and technological services – – – – – – – – –
Legal services – – – – – – – – –
Contractors 2 278 – 2 632 2 073 2 073 1 048 4 073 2 857 2 990 288.6
Agency and support / outsourced services – 75 86 110 110 – – – –
Entertainment – – – – – – – – –
Fleet services (including government motor transport) – – – – – – – – –
Housing – – – – – – – – –
Inventory: Clothing material and accessories – – 220 – – – – – –
Inventory: Farming supplies 2 626 3 685 2 764 2 361 2 361 2 167 3 508 2 026 2 120 61.9
Inventory: Food and food supplies – – – – – – – – –
Inventory: Chemicals,fuel,oil,gas,wood and coal 336 568 404 439 439 594 97 101 106 (83.7)
Inventory: Learner and teacher support material – – – – – – – – –
Inventory: Materials and supplies 2 438 1 674 1 251 931 931 2 296 864 546 571 (62.4)
Inventory: Medical supplies 3 – – – – – 15 16 17
Inventory: Medicine – – – – – – – – –
Medsas inventory interface – – – – – – – – –
Inventory: Other supplies 1 237 – 355 70 70 2 354 294 308 17600.0
Consumable supplies 509 397 541 318 318 885 730 764 799 (17.5)
Consumable: Stationery,printing and office supplies – – – – – – – – –
Operating leases – – – – – – – – –
Property payments – – – – – – – – –
Transport provided: Departmental activity – – – – – – – – –
Travel and subsistence 20 127 34 – – 22 234 245 256 963.6
Training and development 684 340 424 388 388 447 532 423 425 19.0
Operating payments – – – – – – – – –
Venues and facilities 104 – – 10 10 – – – –
Rental and hiring 13 – – – – – – – –
Interest and rent on land – – – – – – – – –
Interest – – – – – – – – –
Rent on land – – – – – – – – –
Transfers and subsidies – 1 494 2 092 2 100 2 100 2 100 – – – (100.0)
Provinces and municipalities – – – – – – – – –
Provinces – – – – – – – – –
Provincial Revenue Funds – – – – – – – – –
Provincial agencies and funds – – – – – – – – –
Municipalities – – – – – – – – –
Municipalities – – – – – – – – –
Municipal agencies and funds – – – – – – – – –
Departmental agencies and accounts – 1 494 2 092 2 100 2 100 2 100 – – – (100.0)
Social security funds – – – – – – – – –
Provide list of entities receiving transfers – 1 494 2 092 2 100 2 100 2 100 – – – (100.0)
Higher education institutions – – – – – – – – –
Foreign governments and international organisations – – – – – – – – –
Public corporations and private enterprises – – – – – – – – –
Public corporations – – – – – – – – –
Subsidies on production – – – – – – – – –
Other transfers – – – – – – – – –
Private enterprises – – – – – – – – –
Subsidies on production – – – – – – – – –
Other transfers – – – – – – – – –
Non-profit institutions – – – – – – – – –
Households – – – – – – – – –
Social benefits – – – – – – – – –
Other transfers to households – – – – – – – – –
Payments for capital assets 8 792 2 485 999 570 570 1 060 – 3 084 3 224 (100.0)
Buildings and other fixed structures 346 – – – – 440 – 1 554 1 624 (100.0)
Buildings – – – – – – – – –
Other fixed structures 346 – – – – 440 – 1 554 1 624 (100.0)
Machinery and equipment 8 446 2 485 999 570 570 620 – 1 530 1 600 (100.0)
Transport equipment – – – – – – – – –
Other machinery and equipment 8 446 2 485 999 570 570 620 – 1 530 1 600 (100.0)
Heritage Assets – – – – – – – – –
Specialised military assets – – – – – – – – –
Biological assets – – – – – – – – –
Land and sub-soil assets – – – – – – – – –
Software and other intangible assets – – – – – – – – –
Payments for financial assets – – – – – – – – –
Total economic classification 19 863 11 838 12 513 12 700 12 700 12 700 12 935 13 470 14 073 1.9
471