
Page 419 - Provincial Treasury Estimates.pdf
P. 419
Estimates of the Provincial Revenue and Expenditure (EPRE) – Financial Year 2023/24
x IDP Coordination: To provide support for effective and efficient municipal integrated development
planning.
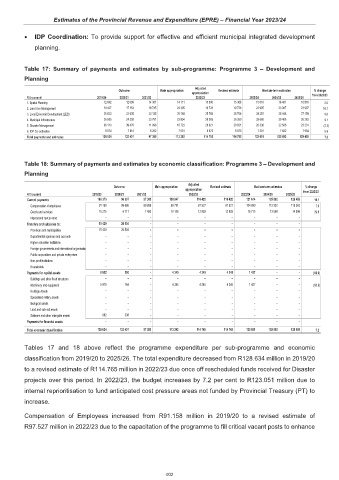
Table 17: Summary of payments and estimates by sub-programme: Programme 3 – Development and
Planning
Adjusted
Outcome Main appropriation Revised estimate Medium-term estimates % change
appropriation from 2022/23
R thousand 2019/20 2020/21 2021/22 2022/23 2023/24 2024/25 2025/26
1. Spatial Planning 12 842 12 099 14 361 14 171 15 306 15 306 15 618 16 401 16 876 2.0
2. Land Use Management 19 427 17 153 18 745 24 305 19 728 19 728 22 905 23 387 23 997 16.1
3. Local Economic Development (LED) 25 623 22 635 23 135 25 168 25 768 25 768 28 251 26 448 27 159 9.6
4. Municipal Infrastructure 26 055 24 226 23 761 23 894 26 269 26 269 28 660 29 408 30 262 9.1
5. Disaster Management 36 113 39 470 11 096 18 723 20 821 20 821 20 336 22 566 23 231 (2.3)
6. IDP Co-ordination 8 574 7 818 6 282 7 031 6 873 6 873 7 281 7 682 7 934 5.9
Total payments and estimates 128 634 123 401 97 380 113 292 114 765 114 765 123 051 125 892 129 459 7.2
Table 18: Summary of payments and estimates by economic classification: Programme 3 – Development and
Planning
Adjusted
Outcome Main appropriation Revised estimate Medium-term estimates % change
appropriation
R thousand 2019/20 2020/21 2021/22 2022/23 2023/24 2024/25 2025/26 from 2022/23
Current payments 106 373 96 397 97 380 108 947 110 420 110 420 121 614 125 892 129 459 10.1
Compensation of employees 91 158 89 686 89 888 98 791 97 527 97 527 104 899 112 332 115 363 7.6
Goods and services 15 215 6 711 7 492 10 156 12 893 12 893 16 715 13 560 14 096 29.6
Interest and rent on land – – – – – – – – –
Transfers and subsidies to: 15 429 26 504 – – – – – – –
Provinces and municipalities 15 429 26 504 – – – – – – –
Departmental agencies and accounts – – – – – – – – –
Higher education institutions – – – – – – – – –
Foreign governments and international organisation – – – – – – – – –
Public corporations and private enterprises – – – – – – – – –
Non-profit institutions – – – – – – – – –
Households – – – – – – – – –
Payments for capital assets 6 832 500 – 4 345 4 345 4 345 1 437 – – (66.9)
Buildings and other fixed structures – – – – – – – – –
Machinery and equipment 5 970 164 – 4 345 4 345 4 345 1 437 – – (66.9)
Heritage Assets – – – – – – – – –
Specialised military assets – – – – – – – – –
Biological assets – – – – – – – – –
Land and sub-soil assets – – – – – – – – –
Software and other intangible assets 862 336 – – – – – – –
Payments for financial assets – – – – – – – – –
Total economic classification 128 634 123 401 97 380 113 292 114 765 114 765 123 051 125 892 129 459 7.2
Tables 17 and 18 above reflect the programme expenditure per sub-programme and economic
classification from 2019/20 to 2025/26. The total expenditure decreased from R128.634 million in 2019/20
to a revised estimate of R114.765 million in 2022/23 due once off rescheduled funds received for Disaster
projects over this period. In 2022/23, the budget increases by 7.2 per cent to R123.051 million due to
internal reprioritisation to fund anticipated cost pressure areas not funded by Provincial Treasury (PT) to
increase.
Compensation of Employees increased from R91.158 million in 2019/20 to a revised estimate of
R97.527 million in 2022/23 due to the capacitation of the programme to fill critical vacant posts to enhance
402