
Page 414 - Provincial Treasury Estimates.pdf
P. 414
Department: Cooperative Governance and Traditional Affairs
Water Intervention project and audit improvement support, which was later insourced by the department.
There are no further transfers to municipalities made by the department due to budget cuts.
8. 8. Programme description
8.1. Programme 1: Administration
Purpose: To give effective strategic leadership and proficient administration support services to the
Department of Cooperative Governance and Traditional Affairs. The programme has 2 sub-programmes:
x Office of the MEC: To provide political direction and set policy priorities for intervention and play an
oversight over the Department to ensure alignment to its mandate and mainstreaming the needs of
vulnerable groups; and
x Corporate Services: To provide efficient and effective corporate support services to the Department.
Table 11: Summary of payments and estimates by sub-programme: Programme 1
Adjusted
Outcome Main appropriation Revised estimate Medium-term estimates % change
appropriation
R thousand 2019/20 2020/21 2021/22 2022/23 2023/24 2024/25 2025/26 from 2022/23
1. Office of the MEC 12 042 12 882 12 406 11 882 12 824 12 824 11 120 10 308 10 531 (13.3)
2. Corporate Services 242 873 234 687 241 132 233 789 255 923 255 923 264 349 264 578 276 979 3.3
Total payments and estimates 254 915 247 569 253 538 245 671 268 747 268 747 275 469 274 886 287 510 2.5
Table 12: Summary of payments and estimates by economic classification: Programme 1
Adjusted
Outcome Main appropriation Revised estimate Medium-term estimates % change
appropriation from 2022/23
R thousand 2019/20 2020/21 2021/22 2022/23 2023/24 2024/25 2025/26
Current payments 234 995 209 356 235 143 229 884 246 820 246 820 256 674 261 354 269 806 4.0
Compensation of employees 172 095 170 832 175 883 189 101 187 759 187 759 194 987 206 383 212 464 3.8
Goods and services 62 893 38 521 59 254 40 783 59 061 59 061 61 687 54 971 57 342 4.4
Interest and rent on land 7 3 6 – – – – – –
Transfers and subsidies to: 4 725 22 761 6 833 1 885 5 004 5 004 5 313 3 496 3 656 6.2
Provinces and municipalities – – – – – – – – –
Departmental agencies and accounts – – – – – – – – –
Higher education institutions – – – – – – – – –
Foreign governments and international organisations – – – – – – – – –
Public corporations and private enterprises – – – – – – – – –
Non-profit institutions – – – – – – – – –
Households 4 725 22 761 6 833 1 885 5 004 5 004 5 313 3 496 3 656 6.2
Payments for capital assets 15 195 14 895 10 828 13 902 16 923 16 923 13 482 10 036 14 048 (20.3)
Buildings and other fixed structures – – – – – – – – –
Machinery and equipment 15 195 14 895 10 828 13 902 16 923 16 923 12 982 10 036 14 048 (23.3)
Heritage Assets – – – – – – – – –
Specialised military assets – – – – – – – – –
Biological assets – – – – – – – – –
Land and sub-soil assets – – – – – – – – –
Software and other intangible assets – – – – – – 500 – –
Payments for financial assets – 557 734 – – – – – –
Total economic classification 254 915 247 569 253 538 245 671 268 747 268 747 275 469 274 886 287 510 2.5
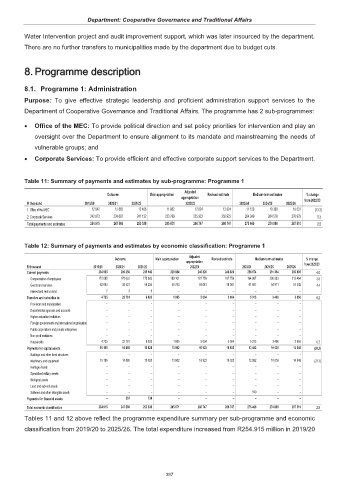
Tables 11 and 12 above reflect the programme expenditure summary per sub-programme and economic
classification from 2019/20 to 2025/26. The total expenditure increased from R254.915 million in 2019/20
397