
Page 413 - Provincial Treasury Estimates.pdf
P. 413
Estimates of the Provincial Revenue and Expenditure (EPRE) – Financial Year 2023/24
7.4.2 Conditional grants payments by economic classification
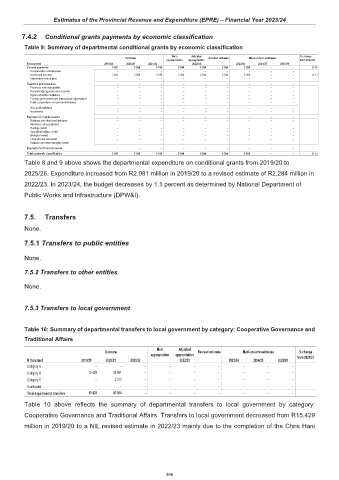
Table 9: Summary of departmental conditional grants by economic classification
Main Adjusted % change
Outcome Revised estimate Medium-term estimates
appropriation appropriation from 2022/23
R thousand 2019/20 2020/21 2021/22 2022/23 2023/24 2024/25 2025/26
Current payments 2 081 2 089 2 186 2 284 2 284 2 284 2 260 – – (1.1)
Compensation of employees – – – – – – – – –
Goods and services 2 081 2 089 2 186 2 284 2 284 2 284 2 260 – – (1.1)
Interest and rent on land – – – – – – – – –
Transfers and subsidies – – – – – – – – –
Provinces and municipalities – – – – – – – – –
Departmental agencies and accounts – – – – – – – – –
Higher education institutions – – – – – – – – –
Foreign governments and international organisations – – – – – – – – –
Public corporations and private enterprises – – – – – – – – –
Non-profit institutions – – – – – – – – –
Households – – – – – – – – –
Payments for capital assets – – – – – – – – –
Buildings and other fixed structures – – – – – – – – –
Machinery and equipment – – – – – – – – –
Heritage Assets – – – – – – – – –
Specialised military assets – – – – – – – – –
Biological assets – – – – – – – – –
Land and sub-soil assets – – – – – – – – –
Software and other intangible assets – – – – – – – – –
Payments for financial assets – – – – – – – – –
Total economic classification 2 081 2 089 2 186 2 284 2 284 2 284 2 260 – – (1.1)
Table 8 and 9 above shows the departmental expenditure on conditional grants from 2019/20 to
2025/26. Expenditure increased from R2.081 million in 2019/20 to a revised estimate of R2.284 million in
2022/23. In 2023/24, the budget decreases by 1.1 percent as determined by National Department of
Public Works and Infrastructure (DPW&I).
7.5. Transfers
None.
7.5.1 Transfers to public entities
None.
7.5.2 Transfers to other entities
None.
7.5.3 Transfers to local government
Table 10: Summary of departmental transfers to local government by category: Cooperative Governance and
Traditional Affairs
Main Adjusted
Outcome Revised estimate Medium-term estimates % change
appropriation appropriation
R thousand 2019/20 2020/21 2021/22 2022/23 2023/24 2024/25 2025/26 from 2022/23
Category A – – – – – – – – –
Category B 15 429 38 991 – – – – – – –
Category C – 2 513 – – – – – – –
Unallocated – – – – – – – – –
Total departmental transfers 15 429 41 504 – – – – – – –
Table 10 above reflects the summary of departmental transfers to local government by category:
Cooperative Governance and Traditional Affairs. Transfers to local government decreased from R15.429
million in 2019/20 to a NIL revised estimate in 2022/23 mainly due to the completion of the Chris Hani
396