
Page 408 - Provincial Treasury Estimates.pdf
P. 408
Department: Cooperative Governance and Traditional Affairs
7. 7. Payment summary
7.1. Key assumptions
The following key factors provide the framework for the development of the departmental 2023 MTEF
budget proposal:
x Growth in personnel wage bill as per the budget guide and hence zero-based costing of personnel
while providing for only Pay-progression and the COLA implications as allocated by PT.
x Non personnel inflationary projections informed by the revised CPI estimates.
x Commitment to the implementation of the cost containment measures; and
x Implementation of National baseline budget adjustments in terms of the PES formula.
7.2. Programme summary
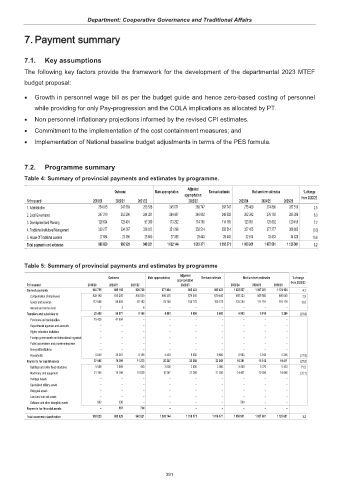
Table 4: Summary of provincial payments and estimates by programme.
Adjusted
Outcome Main appropriation Revised estimate Medium-term estimates % change
appropriation from 2022/23
R thousand 2019/20 2020/21 2021/22 2022/23 2023/24 2024/25 2025/26
1. Administration 254 915 247 569 253 538 245 671 268 747 268 747 275 469 274 886 287 510 2.5
2. Local Governance 247 310 252 296 244 321 264 487 246 902 246 902 262 342 276 193 285 398 6.3
3. Development and Planning 128 634 123 401 97 380 113 292 114 765 114 765 123 051 125 892 129 459 7.2
4. Traditional Institutional Management 330 277 334 267 328 022 351 296 358 514 358 514 357 425 377 277 388 885 (0.3)
5. House Of Traditional Leaders 27 684 23 396 25 660 27 398 29 443 29 443 32 614 33 433 34 629 10.8
Total payments and estimates 988 820 980 929 948 921 1 002 144 1 018 371 1 018 371 1 050 901 1 087 681 1 125 881 3.2
Table 5: Summary of provincial payments and estimates by programme
Adjusted
Outcome Main appropriation Revised estimate Medium-term estimates % change
appropriation
R thousand 2019/20 2020/21 2021/22 2022/23 2023/24 2024/25 2025/26 from 2022/23
Current payments 940 755 895 102 928 728 977 494 985 423 985 423 1 025 527 1 067 351 1 101 164 4.1
Compensation of employees 828 190 835 205 836 539 899 335 879 645 879 645 905 323 955 560 985 045 2.9
Goods and services 112 558 59 894 92 183 78 159 105 778 105 778 120 204 111 791 116 119 13.6
Interest and rent on land 7 3 6 – – – – – –
Transfers and subsidies to: 20 469 66 871 8 186 4 403 9 680 9 680 6 993 5 018 5 246 (27.8)
Provinces and municipalities 15 429 41 504 – – – – – – –
Departmental agencies and accounts – – – – – – – – –
Higher education institutions – – – – – – – – –
Foreign governments and international organisati – – – – – – – – –
Public corporations and private enterprises – – – – – – – – –
Non-profit institutions – – – – – – – – –
Households 5 040 25 367 8 186 4 403 9 680 9 680 6 993 5 018 5 246 (27.8)
Payments for capital assets 27 596 18 399 11 273 20 247 23 268 23 268 18 381 15 312 19 471 (21.0)
Buildings and other fixed structures 5 569 2 869 445 2 000 2 000 2 000 3 430 5 276 5 423 71.5
Machinery and equipment 21 165 15 194 10 828 18 247 21 268 21 268 14 451 10 036 14 048 (32.1)
Heritage Assets – – – – – – – – –
Specialised military assets – – – – – – – – –
Biological assets – – – – – – – – –
Land and sub-soil assets – – – – – – – – –
Software and other intangible assets 862 336 – – – – 500 – –
Payments for financial assets – 557 734 – – – – – –
Total economic classification 988 820 980 929 948 921 1 002 144 1 018 371 1 018 371 1 050 901 1 087 681 1 125 881 3.2
391