Page 412 - Provincial Treasury Estimates.pdf
P. 412

Department: Cooperative Governance and Traditional Affairs

           7.2. Infrastructure payments

           Table 7: Departmental infrastructure payments
                                                          Main    Adjusted
                                        Outcome                          Revised estimate  Medium-term estimates  % change from
                                                        appropriation  appropriation                         2022/23
            R thousand          2019/20  2020/21  2021/22         2022/23          2023/24  2024/25  2025/26
            Existing infrastructure assets                      2 079                     2 089                     2 631                     2 284                     2 284                     2 319                     3 110  –  –    34.1
             Maintenance and repairs                       2 079                     2 089                     2 186                     2 284                     2 284                     2 319                     2 260  –    –  (2.5)
             Upgrades and additions  –       –        –        –       –        –       –        –          –
             Refurbishment and rehabilitation  –  –  445       –       20      20       –        –        –
            New infrastructure assets                      5 569                     2 869  –                     2 000                     1 980                     1 980                     3 430                     5 276                     5 423  29.0
            Infrastructure transfers                    15 429                   26 504  –  –  –  –  –  –  –
             Current                 –       –        –        –       –        –       –        –        –
             Capital                            15 429                   26 504  –  –  –  –  –   –          –
            Infrastructure payments for financial
            assets                   –       –        –        –       –        –       –        –        –
            Infrastructure leases    –       –        –        –       –        –       –        –        –
            Non infrastructure       –       –        –        –       –        –       –        –          –
            Total department infrastructure                    23 077                   31 462                     2 631                     4 284                     4 284                     4 319                     5 690                     5 276                     5 423  31.7
           1. Total provincial infrastructure is the sum of "Capital" plus "Recurrent maintenance". This includes non infrastructure items.
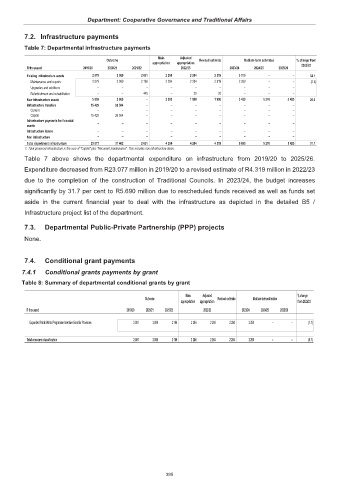
           Table 7 above shows the departmental expenditure on infrastructure  from 2019/20 to 2025/26.
           Expenditure decreased from R23.077 million in 2019/20 to a revised estimate of R4.319 million in 2022/23

           due to  the completion  of the construction  of Traditional Councils. In 2023/24,  the budget increases
           significantly by 31.7 per cent to R5.690 million due to rescheduled funds received as well as funds set
           aside in the  current financial year  to deal with the infrastructure as  depicted in  the detailed B5 /

           Infrastructure project list of the department.

           7.3.   Departmental Public-Private Partnership (PPP) projects

           None.


           7.4.   Conditional grant payments

          7.4.1   Conditional grants payments by grant
          Table 8: Summary of departmental conditional grants by grant

                                                                    Main   Adjusted                        % change
                                                      Outcome                  Revised estimate  Medium-term estimates
                                                                  appropriation  appropriation             from 2022/23
            R thousand                         2019/20  2020/21  2021/22  2022/23       2023/24  2024/25  2025/26

                                                                                                  –
             Expanded Public Works Programme Incentive Grant for Provinces                      2 081                     2 089                     2 186                     2 284                     2 284                     2 284                     2 260                                                       –  (1.1)

                                                                                                  –
            Total economic classification                         2 081                     2 089                     2 186                     2 284                     2 284                     2 284                     2 260                                                       –  (1.1)


                                                             395
   407   408   409   410   411   412   413   414   415   416   417