
Page 305 - Provincial Treasury Estimates.pdf
P. 305
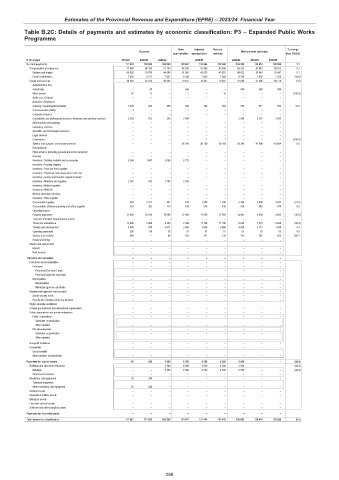
Estimates of the Provincial Revenue and Expenditure (EPRE) – 2023/24 Financial Year
Table B.2C: Details of payments and estimates by economic classification: P3 – Expanded Public Works
Programme
Main Adjusted Revised % change
Outcome Medium-term estimates
appropriation appropriation estimate from 2022/23
R thousand 2019/20 2020/21 2021/22 2022/23 2023/24 2024/25 2025/26
Current payments 117 578 130 960 148 398 128 647 132 943 132 943 134 362 125 410 128 590 1.1
Compensation of employees 77 048 88 150 51 703 58 200 53 496 53 496 56 332 57 842 58 812 5.3
Salaries and wages 69 565 79 879 44 066 51 500 45 653 45 653 49 632 50 840 51 497 8.7
Social contributions 7 483 8 271 7 637 6 700 7 843 7 843 6 700 7 002 7 315 (14.6)
Goods and services 40 530 42 810 96 695 70 447 79 447 79 447 78 030 67 568 69 778 (1.8)
Administrative fees – – – – – – – – –
Advertising – 28 – 544 – – 544 569 594
Minor assets 26 13 – – – 19 – – – (100.0)
Audit cost: External – – – – – – – – –
Bursaries: Employees – – – – – – – – –
Catering: Departmental activities 1 303 254 586 782 782 689 782 817 853 13.5
Communication (G&S) 3 – – – – – – – –
Computer services – – – – – – – – –
Consultants and professional services: Business and advisory services 2 558 672 254 3 049 – – 3 049 3 187 2 503
Infrastructure and planning – – – – – – – – –
Laboratory services – – – – – – – – –
Scientific and technological services – – – – – – – – –
Legal services – – – – – – – – –
Contractors – – – – 7 7 – – – (100.0)
Agency and support / outsourced services – – – 36 760 36 760 36 760 39 246 41 008 42 854 6.8
Entertainment – – – – – – – – –
Fleet services (including government motor transport) – – – – – – – – –
Housing – – – – – – – – –
Inventory: Clothing material and accessories 3 364 1 847 3 006 2 712 – – – – –
Inventory: Farming supplies – – – – – – – – –
Inventory: Food and food supplies – – – – – – – – –
Inventory: Chemicals,fuel,oil,gas,wood and coal – – – – – – – – –
Inventory: Learner and teacher support material – – – – – – – – –
Inventory: Materials and supplies 2 263 742 2 188 2 165 – – – – –
Inventory: Medical supplies – – – – – – – – –
Inventory: Medicine – – – – – – – – –
Medsas inventory interface – – – – – – – – –
Inventory: Other supplies – – – – – – – – –
Consumable supplies 259 2 017 491 519 7 396 7 396 5 396 5 638 5 891 (27.0)
Consumable: Stationery,printing and office supplies 316 382 113 618 618 618 618 645 674 0.0
Operating leases – – – – – – – – –
Property payments 11 080 32 010 76 066 17 958 17 958 17 958 14 941 4 656 4 865 (16.8)
Transport provided: Departmental activity – – – – – – – – –
Travel and subsistence 13 596 3 988 9 253 2 049 11 748 11 748 8 649 7 491 8 808 (26.4)
Training and development 5 069 788 4 611 2 486 3 986 3 986 4 000 2 717 1 858 0.4
Operating payments 208 69 38 51 51 51 51 53 55 0.0
Venues and facilities 485 – 89 754 141 215 754 787 823 250.7
Rental and hiring – – – – – – – – –
Interest and rent on land – – – – – – – – –
Interest – – – – – – – – –
Rent on land – – – – – – – – –
Transfers and subsidies – – – – – – – – –
Provinces and municipalities – – – – – – – – –
Provinces – – – – – – – – –
Provincial Revenue Funds – – – – – – – – –
Provincial agencies and funds – – – – – – – – –
Municipalities – – – – – – – – –
Municipalities – – – – – – – – –
Municipal agencies and funds – – – – – – – – –
Departmental agencies and accounts – – – – – – – – –
Social security funds – – – – – – – – –
Provide list of entities receiving transfers – – – – – – – – –
Higher education institutions – – – – – – – – –
Foreign governments and international organisations – – – – – – – – –
Public corporations and private enterprises – – – – – – – – –
Public corporations – – – – – – – – –
Subsidies on production – – – – – – – – –
Other transfers – – – – – – – – –
Private enterprises – – – – – – – – –
Subsidies on production – – – – – – – – –
Other transfers – – – – – – – – –
Non-profit institutions – – – – – – – – –
Households – – – – – – – – –
Social benefits – – – – – – – – –
Other transfers to households – – – – – – – – –
Payments for capital assets 29 340 2 560 6 000 4 500 4 500 2 500 – – (44.4)
Buildings and other fixed structures – – 2 560 6 000 4 500 4 500 2 500 – – (44.4)
Buildings – – 2 560 6 000 4 500 4 500 2 500 – – (44.4)
Other fixed structures – – – – – – – – –
Machinery and equipment 29 340 – – – – – – –
Transport equipment – – – – – – – – –
Other machinery and equipment 29 340 – – – – – – –
Heritage Assets – – – – – – – – –
Specialised military assets – – – – – – – – –
Biological assets – – – – – – – – –
Land and sub-soil assets – – – – – – – – –
Software and other intangible assets – – – – – – – – –
Payments for financial assets – – – – – – – – –
Total economic classification 117 607 131 300 150 958 134 647 137 443 137 443 136 862 125 410 128 590 (0.4)
288