
Page 304 - Provincial Treasury Estimates.pdf
P. 304
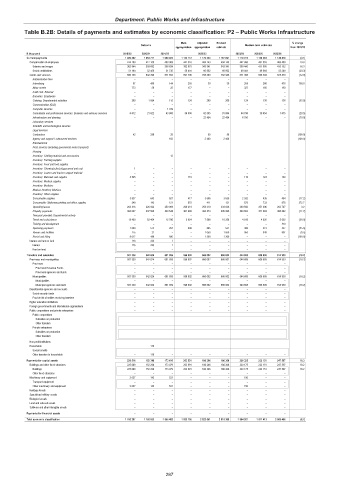
Department: Public Works and Infrastructure
Table B.2B: Details of payments and estimates by economic classification: P2 – Public Works Infrastructure
Main Adjusted Revised % change
Outcome Medium-term estimates
appropriation appropriation estimate from 2022/23
R thousand 2019/20 2020/21 2021/22 2022/23 2023/24 2024/25 2025/26
Current payments 1 020 442 1 054 771 1 080 023 1 133 112 1 170 343 1 167 091 1 119 274 1 130 453 1 146 870 (4.1)
Compensation of employees 414 108 412 150 408 369 441 316 404 143 404 143 447 886 461 059 468 400 10.8
Salaries and wages 362 944 359 692 356 634 382 875 343 341 343 341 399 445 411 995 415 152 16.3
Social contributions 51 164 52 458 51 735 58 441 60 802 60 802 48 441 49 064 53 248 (20.3)
Goods and services 606 158 642 398 671 653 691 796 766 200 762 948 671 388 669 394 678 470 (12.0)
Administrative fees – – – – – – – – –
Advertising 87 480 144 255 30 30 255 266 478 750.0
Minor assets 773 56 25 177 – – 327 185 193
Audit cost: External – – – – – – – – –
Bursaries: Employees – – – – – – – – –
Catering: Departmental activities 309 1 094 115 124 269 269 124 130 136 (53.9)
Communication (G&S) – – – – – – – – –
Computer services – – 1 419 – – – – – –
Consultants and professional services: Business and advisory services 6 612 21 622 63 908 56 000 62 505 91 864 64 796 39 454 1 675 (29.5)
Infrastructure and planning – – – – 22 494 22 494 6 750 – – (70.0)
Laboratory services – – – – – – – – –
Scientific and technological services – – – – – – – – –
Legal services – – – – – – – – –
Contractors 42 296 28 – 50 50 – – – (100.0)
Agency and support / outsourced services – – 162 – 2 400 2 400 – – – (100.0)
Entertainment – – – – – – – – –
Fleet services (including government motor transport) – – – – – – – – –
Housing – – – – – – – – –
Inventory: Clothing material and accessories – – 12 – – – – – –
Inventory: Farming supplies – – – – – – – – –
Inventory: Food and food supplies – – – – – – – – –
Inventory: Chemicals,fuel,oil,gas,wood and coal 1 – – – – – – – –
Inventory: Learner and teacher support material – – – – – – – – –
Inventory: Materials and supplies 2 545 – – 119 – – 119 124 130
Inventory: Medical supplies – – – – – – – – –
Inventory: Medicine – – – – – – – – –
Medsas inventory interface – – – – – – – – –
Inventory: Other supplies – – – – – – – – –
Consumable supplies 3 837 643 527 417 3 695 3 539 2 932 435 454 (17.2)
Consumable: Stationery,printing and office supplies 248 142 121 572 411 121 572 733 975 372.7
Operating leases 264 316 226 922 250 909 269 219 259 219 233 026 240 592 251 396 262 707 3.2
Property payments 304 697 337 595 340 548 361 689 404 374 395 995 349 652 371 083 405 082 (11.7)
Transport provided: Departmental activity – – – – – – – – –
Travel and subsistence 13 430 52 464 12 785 2 924 7 598 10 259 4 019 4 326 5 062 (60.8)
Training and development – – – – – – – – 450
Operating payments 1 069 574 264 300 805 551 300 313 327 (45.6)
Venues and facilities 175 21 – – 1 050 1 050 950 949 801 (9.5)
Rental and hiring 8 017 489 686 – 1 300 1 300 – – – (100.0)
Interest and rent on land 176 223 1 – – – – – –
Interest 176 223 1 – – – – – –
Rent on land – – – – – – – – –
Transfers and subsidies 507 339 542 934 601 859 596 002 666 002 666 002 544 608 608 809 614 939 (18.2)
Provinces and municipalities 507 339 542 824 601 859 596 002 666 002 666 002 544 608 608 809 614 939 (18.2)
Provinces – – – – – – – – –
Provincial Revenue Funds – – – – – – – – –
Provincial agencies and funds – – – – – – – – –
Municipalities 507 339 542 824 601 859 596 002 666 002 666 002 544 608 608 809 614 939 (18.2)
Municipalities – – – – – – – – –
Municipal agencies and funds 507 339 542 824 601 859 596 002 666 002 666 002 544 608 608 809 614 939 (18.2)
Departmental agencies and accounts – – – – – – – – –
Social security funds – – – – – – – – –
Provide list of entities receiving transfers – – – – – – – – –
Higher education institutions – – – – – – – – –
Foreign governments and international organisations – – – – – – – – –
Public corporations and private enterprises – – – – – – – – –
Public corporations – – – – – – – – –
Subsidies on production – – – – – – – – –
Other transfers – – – – – – – – –
Private enterprises – – – – – – – – –
Subsidies on production – – – – – – – – –
Other transfers – – – – – – – – –
Non-profit institutions – – – – – – – – –
Households – 110 – – – – – – –
Social benefits – – – – – – – – –
Other transfers to households – 110 – – – – – – –
Payments for capital assets 228 516 152 348 173 610 203 991 186 306 186 306 220 325 232 151 247 597 18.3
Buildings and other fixed structures 225 889 152 206 173 079 203 991 186 306 186 306 220 175 232 151 247 597 18.2
Buildings 225 889 152 206 173 079 203 991 186 306 186 306 220 175 232 151 247 597 18.2
Other fixed structures – – – – – – – – –
Machinery and equipment 2 627 142 531 – – – 150 – –
Transport equipment – – – – – – – – –
Other machinery and equipment 2 627 142 531 – – – 150 – –
Heritage Assets – – – – – – – – –
Specialised military assets – – – – – – – – –
Biological assets – – – – – – – – –
Land and sub-soil assets – – – – – – – – –
Software and other intangible assets – – – – – – – – –
Payments for financial assets – – – – – – – – –
Total economic classification 1 756 297 1 750 053 1 855 492 1 933 105 2 022 651 2 019 399 1 884 207 1 971 413 2 009 406 (6.7)
287