
Page 303 - Provincial Treasury Estimates.pdf
P. 303
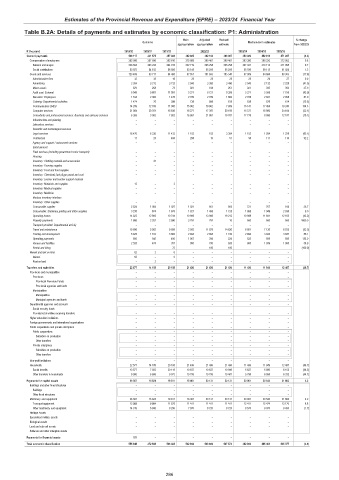
Estimates of the Provincial Revenue and Expenditure (EPRE) – 2023/24 Financial Year
Table B.2A: Details of payments and estimates by economic classification: P1: Administration
Main Adjusted Revised % change
Outcome Medium-term estimates
appropriation appropriation estimate from 2022/23
R thousand 2019/20 2020/21 2021/22 2022/23 2023/24 2024/25 2025/26
Current payments 506 117 441 575 457 024 462 925 462 102 466 007 450 389 452 910 471 287 (3.4)
Compensation of employees 382 566 357 856 362 610 375 868 360 467 360 467 363 380 368 226 372 982 0.8
Salaries and wages 328 594 303 244 304 015 322 719 305 258 305 258 307 441 310 113 311 958 0.7
Social contributions 53 972 54 612 58 595 53 149 55 209 55 209 55 939 58 113 61 024 1.3
Goods and services 123 489 83 717 94 408 87 057 101 635 105 540 87 009 84 684 98 305 (17.6)
Administrative fees 32 35 16 25 25 25 25 26 27 0.0
Advertising 2 264 3 213 3 732 2 040 3 300 3 490 2 040 2 132 2 228 (41.5)
Minor assets 870 258 72 321 184 251 321 335 350 27.9
Audit cost: External 8 948 9 601 11 091 5 271 8 721 9 399 5 271 5 508 7 756 (43.9)
Bursaries: Employees 1 534 2 363 1 476 2 709 2 709 1 683 2 709 2 831 2 958 61.0
Catering: Departmental activities 1 474 76 298 738 588 615 538 579 614 (12.5)
Communication (G&S) 14 209 12 703 11 905 15 962 13 962 7 899 16 141 17 454 18 240 104.3
Computer services 21 084 20 761 15 636 16 277 17 397 20 195 15 727 18 900 24 614 (22.1)
Consultants and professional services: Business and advisory services 6 385 3 083 7 802 16 861 21 861 19 787 17 779 8 995 12 187 (10.1)
Infrastructure and planning – – – – – – – – –
Laboratory services – – – – – – – – –
Scientific and technological services – – – – – – – – –
Legal services 16 470 6 230 11 433 1 152 152 3 304 1 152 1 204 1 258 (65.1)
Contractors 11 23 493 298 10 51 98 111 116 92.2
Agency and support / outsourced services – – – – – – – – –
Entertainment – – – – – – – – –
Fleet services (including government motor transport) – – – – – – – – –
Housing – – – – – – – – –
Inventory: Clothing material and accessories – 47 – – – – – – –
Inventory: Farming supplies – – – – – – – – –
Inventory: Food and food supplies – – – – – – – – –
Inventory: Chemicals,fuel,oil,gas,wood and coal – – – – – – – – –
Inventory: Learner and teacher support material – – – – – – – – –
Inventory: Materials and supplies 12 – 2 – – – – – –
Inventory: Medical supplies – – – – – – – – –
Inventory: Medicine – – – – – – – – –
Medsas inventory interface – – – – – – – – –
Inventory: Other supplies – – – – – – – – –
Consumable supplies 2 524 1 054 1 027 1 021 661 569 721 767 814 26.7
Consumable: Stationery,printing and office supplies 3 238 674 1 679 1 821 1 456 1 728 1 866 1 949 2 036 8.0
Operating leases 14 823 12 905 10 744 10 909 13 909 19 212 10 909 11 641 12 165 (43.2)
Property payments 1 906 2 257 2 590 3 704 704 10 500 500 500 4900.0
Transport provided: Departmental activity – – – – – – – – –
Travel and subsistence 18 696 5 902 9 895 2 992 11 878 14 630 6 801 7 130 6 935 (53.5)
Training and development 5 825 1 513 3 682 2 894 2 894 1 742 2 894 3 024 3 837 66.1
Operating payments 656 545 406 1 067 394 224 522 559 585 133.0
Venues and facilities 2 528 474 357 995 730 626 995 1 039 1 085 58.9
Rental and hiring – – 72 – 100 100 – – – (100.0)
Interest and rent on land 62 2 6 – – – – – –
Interest 62 – 6 – – – – – –
Rent on land – 2 – – – – – – –
Transfers and subsidies 22 577 14 109 29 188 21 436 21 436 21 436 11 436 11 949 12 487 (46.7)
Provinces and municipalities – – – – – – – – –
Provinces – – – – – – – – –
Provincial Revenue Funds – – – – – – – – –
Provincial agencies and funds – – – – – – – – –
Municipalities – – – – – – – – –
Municipalities – – – – – – – – –
Municipal agencies and funds – – – – – – – – –
Departmental agencies and accounts – – – – – – – – –
Social security funds – – – – – – – – –
Provide list of entities receiving transfers – – – – – – – – –
Higher education institutions – – – – – – – – –
Foreign governments and international organisations – – – – – – – – –
Public corporations and private enterprises – – – – – – – – –
Public corporations – – – – – – – – –
Subsidies on production – – – – – – – – –
Other transfers – – – – – – – – –
Private enterprises – – – – – – – – –
Subsidies on production – – – – – – – – –
Other transfers – – – – – – – – –
Non-profit institutions – – – – – – – – –
Households 22 577 14 109 29 188 21 436 21 436 21 436 11 436 11 949 12 487 (46.7)
Social benefits 13 577 7 503 20 115 10 637 10 637 10 949 5 637 5 890 6 155 (48.5)
Other transfers to households 9 000 6 606 9 073 10 799 10 799 10 487 5 799 6 059 6 332 (44.7)
Payments for capital assets 26 387 16 824 19 811 18 481 20 131 20 131 20 981 20 544 21 603 4.2
Buildings and other fixed structures – – – – – – – – –
Buildings – – – – – – – – –
Other fixed structures – – – – – – – – –
Machinery and equipment 26 387 16 824 19 811 18 481 20 131 20 131 20 981 20 544 21 603 4.2
Transport equipment 12 068 9 984 11 575 11 411 11 411 11 411 12 411 12 474 13 170 8.8
Other machinery and equipment 14 319 6 840 8 236 7 070 8 720 8 720 8 570 8 070 8 433 (1.7)
Heritage Assets – – – – – – – – –
Specialised military assets – – – – – – – – –
Biological assets – – – – – – – – –
Land and sub-soil assets – – – – – – – – –
Software and other intangible assets – – – – – – – – –
Payments for financial assets 767 – – – – – – – –
Total economic classification 555 848 472 508 506 023 502 842 503 669 507 574 482 806 485 403 505 377 (4.9)
286