
Page 298 - Provincial Treasury Estimates.pdf
P. 298
Department: Public Works and Infrastructure
8.3.1 Service Delivery Measures
Table 18: Selected service delivery measures for the programme:
Estimated Medium-term estimates
performance
Programme performance measures 2022/23 2023/24 2024/25 2025/26
Number of interventions implemented to support Public Bodies 7 7 7 7
Number of work opportunities created by Provincial Public Works and Infrastructure 4 000 4 000 4 040 4 100
Number of ICDP contractors supported 160 160 160 160
Number of emerging contractors supported 100 100 100 100
Number of ICDP contractors upgraded in Construction Industry Development Board (CIDB) grading 50 20 60 80
Number of SMME Development Strategy activities implemented 4 1 1 1
Number of enterprises supported in the Property Incubator Programme 50 20 60 80
Number of small speciality contractors established 4 1 1 1
Number of participants in the APTCoD programme 1 000 1 060 1 060 1 100
Number of APTCoD learners passed trade test 50 100 110 150
Number of NYS learners trained 150 150 150 150
Number of NYS learners passed RPL 50 50 60 70
Number of Public Bodies reporting on EPWP targets in the Province 50 50 50 50
Table 18 above reflects the service delivery measures in respect of EPWP Programme for the 2023 MTEF
period. Key will be the continuation of job creation skills development and support to public bodies.
9. 9. Other programme information
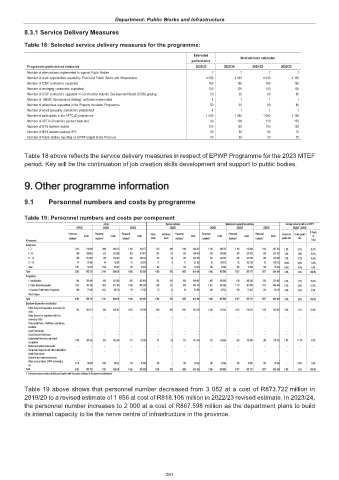
9.1 Personnel numbers and costs by programme
Table 19: Personnel numbers and costs per component
Actual Revised estimate Medium-term expenditure estimate Average annual growth over MTEF
2019/20 2020/21 2021/22 2022/23 2023/24 2024/25 2025/26 2022/23 - 2025/26
Personnel Costs Personnel Costs Personnel Costs Filled Additional Personnel Costs Personnel Costs Personnel Costs Personnel Costs Personnel Costs growth % Costs
of
numbers 1 numbers 1 numbers 1 posts posts numbers 1 numbers 1 numbers 1 numbers 1 growth rate rate
R thousands Total
Salary level
1 – 7 1 142 132 809 1 086 203 179 1 182 314 177 670 430 1 100 286 397 1 156 308 753 1 163 315 404 1 163 341 763 1.9% 6.1% 36.2%
8 – 10 560 390 655 521 315 968 385 197 671 281 61 342 204 478 376 218 598 383 228 316 383 222 707 3.8% 2.9% 25.2%
11 – 12 260 212 652 190 214 491 206 230 234 116 79 195 228 102 232 222 267 245 224 164 245 213 608 7.9% -2.2% 25.6%
13 – 16 74 81 996 44 75 997 41 65 576 31 6 37 83 195 56 102 476 56 103 739 56 106 612 14.8% 8.6% 11.3%
Other 1 017 55 610 1 340 48 521 179 15 024 182 – 182 15 934 180 15 504 180 15 504 180 15 504 -0.4% -0.9% 1.8%
Total 3 052 873 722 3 181 858 156 1 993 822 682 1 280 576 1 856 818 106 2 000 867 598 2 027 887 127 2 027 900 194 3.0% 3.2% 100.0%
Programme
1. Administration 950 382 566 895 357 856 850 362 610 524 281 805 360 467 828 363 380 810 368 226 810 372 982 0.2% 1.1% 42.3%
2. Public Works Infrastructure 1 143 414 108 1 053 412 150 1 044 408 369 686 272 958 404 143 1 072 447 886 1 113 461 059 1 113 468 400 5.1% 5.0% 51.2%
3. Expanded Public Works Programme 960 77 048 1 233 88 150 99 51 703 70 23 93 53 496 100 56 332 104 57 842 104 58 812 3.8% 3.2% 6.5%
Direct charges – – – – – – – – – – – – – – – – – – –
Total 3 052 873 722 3 181 858 156 1 993 822 682 1 280 576 1 856 818 106 2 000 867 598 2 027 887 127 2 027 900 194 3.0% 3.2% 100.0%
Employee dispensation classification
Public Service Act appointees not covered by 765 410 571 888 426 267 1 603 714 794 969 492 1 461 701 245 1 563 727 434 1 578 739 125 1 578 745 565 2.6% 2.1% 83.9%
OSDs
Public Service Act appointees still to be – – – – – – – – – – – – – – – – – – –
covered by OSDs
Professional Nurses, Staff Nurses and Nursing – – – – – – – – – – – – – – – – – – –
Assistants
Legal Professionals – – – – – – – – – – – – – – – – – – –
Social Services Professions – – – – – – – – – – – – – – – – – – –
Engineering Professions and related 1 093 407 542 953 383 368 211 92 384 131 84 215 101 359 257 124 660 269 132 500 269 139 125 7.8% 11.1% 14.3%
occupations
Medical and related professionals – – – – – – – – – – – – – – – – – – –
Therapeutic, Diagnostic and other related Allied – – – – – – – – – – – – – – – – – – –
Health Professionals
Educators and related professionals – – – – – – – – – – – – – – – – – – –
Others such as interns, EPWP, learnerships, 1 194 55 609 1 340 48 521 179 15 504 180 – 180 15 502 180 15 504 180 15 502 180 15 504 – 0.0% 1.8%
etc
Total 3 052 873 722 3 181 858 156 1 993 822 682 1 280 576 1 856 818 106 2 000 867 598 2 027 887 127 2 027 900 194 3.0% 3.2% 100.0%
1. Personnel numbers includes all filled posts together with those posts additional to the approved establishment
Table 19 above shows that personnel number decreased from 3 052 at a cost of R873.722 million in
2019/20 to a revised estimate of 1 856 at cost of R818.106 million in 2022/23 revised estimate. In 2023/24,
the personnel number increases to 2 000 at a cost of R867.598 million as the department plans to build
its internal capacity to be the nerve centre of infrastructure in the province.
281