
Page 296 - Provincial Treasury Estimates.pdf
P. 296
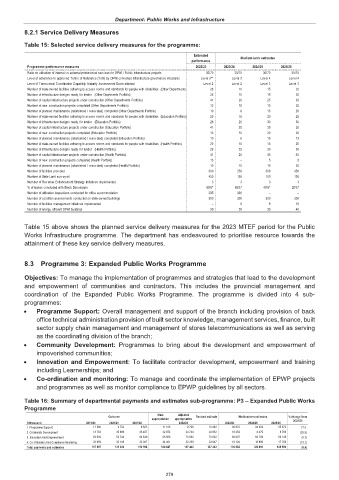
Department: Public Works and Infrastructure
           8.2.1 Service Delivery Measures

           Table 15: Selected service delivery measures for the programme:

                                                                       Estimated       Medium-term estimates
                                                                      performance
            Programme performance measures                             2022/23   2023/24   2024/25   2025/26
            Ratio on utilisation of internal vs external professional services for DPWI / Public Infrastructure projects    30/70  30/70  30/70  30/70
            Level of adherence to approved Terms of Reference (ToR) by DPWI convened Infrastructure governance structures   Level 3**  Level 3  Level 4  Level 4
            Level of Transversal Coordination Capability Maturity Assessment Score attained  Level 2  Level 2  Level 3  Level 3
            Number of state-owned facilities adhering to access norms and standards for people with disabilities  (Other Departments   20  10  15  20

            Number of infrastructure designs ready for tender   (Other Deprtments Portfolio)  26  10  15   20

            Number of capital infrastructure projects under construction (Other Departments Portfolio)  41  20  25    30
            Number of new construction projects completed (Other Departments Portfolio)  13  10  15        20

            Number of planned maintenance (refurbished / renovated) completed (Other Departments Portfolio)  10  9  15    20
            Number of state-owned facilities adhering to access norms and standards for people with disabilities  (Education Portfolio)  20  16  20    25

            Number of infrastructure designs ready for tender   (Education Portfolio)  26  25    30        30
            Number of capital infrastructure projects under construction (Education Portfolio)  41  20  25    30
            Number of new construction projects completed (Education Portfolio)  13    10        20          20

            Number of planned maintenance (refurbished / renovated) completed (Education Portfolio)  10  6  10  13

            Number of state-owned facilities adhering to access norms and standards for people with disabilities  (Health Portfolio)  20  10  15  20

            Number of infrastructure designs ready for tender   (Health Portfolio)  26  25       30        30
            Number of capital infrastructure projects under construction (Health Portfolio)  41  20  45      45
            Number of new construction projects completed (Health Portfolio)  13       –         5         8

            Number of planned maintenance (refurbished / renovated) completed (Health Portfolio)  10  10  15  20
            Number of facilities provided                                   300       250       300         450
            Number of State Land surveyed                                   450       150       100         100
            Number of Revenue Enhancement Strategy initiatives implemented   3         3         3         3
            % of leases concluded with Black Developers                    60%*      65%*      40%*      20%*
            Number of utilisation inspections conducted for office accommodation   295  300      –           –
            Number of condition assessments conducted on state-owned buildings   300  300       300         300

            Number of facilities management initiatives implemented          –         6         8         10
            Number of energy efficient DPWI buildings                        50        30        35        40

           Table 15 above shows the planned service delivery measures for the 2023 MTEF period for the Public
           Works Infrastructure programme. The department has endeavoured to prioritise resource towards the
           attainment of these key service delivery measures.

           8.3  Programme 3: Expanded Public Works Programme

           Objectives: To manage the implementation of programmes and strategies that lead to the development
           and empowerment of  communities and contractors. This includes  the provincial management and
           coordination of the Expanded Public Works  Programme. The programme is divided into  4 sub-
           programmes:
           x    Programme Support: Overall management and support of the branch including provision of back
                office technical administration provision of built sector knowledge, management services, finance, built
                sector supply chain management and management of stores telecommunications as well as serving
                as the coordinating division of the branch;
           x    Community Development: Programmes to bring about the development and empowerment  of
                impoverished communities;
           x    Innovation and Empowerment: To facilitate contractor development, empowerment and training
                including Learnerships; and
           x    Co-ordination and monitoring: To manage and coordinate the implementation of EPWP projects
                and programmes as well as monitor compliance to EPWP guidelines by all sectors.

           Table 16: Summary of departmental payments and estimates sub-programme: P3 – Expanded Public Works
           Programme
                                                          Main   Adjusted
                                         Outcome                        Revised estimate  Medium-term estimates  % change from
                                                        appropriation  appropriation                      2022/23
            R thousand           2019/20  2020/21  2021/22       2022/23          2023/24  2024/25  2025/26
            1. Programme Support   11 386   9 762   8 625   11 106  9 798   18 482  32 872  34 333    35 872  77.9

            2. Community Development   13 753  35 686  45 487  22 974  24 744  24 652  18 259  8 479  8 786  (25.9)
            3. Innovation And Empowerment  59 509  53 744  64 839  66 566  70 662  70 662  66 607  63 709  66 143  (5.7)

            4. Co-Ordination And Compliance Monitoring  32 959  32 108  32 007  34 001  32 239  23 647  19 124  18 889    17 789  (19.1)
            Total payments and estimates                   117 607                   131 300                   150 958                   134 647                   137 443                   137 443                   136 862                   125 410                   128 590  (0.4)
                                                             279