
Page 292 - Provincial Treasury Estimates.pdf
P. 292
Department: Public Works and Infrastructure
Conditional grant payments by economic classification
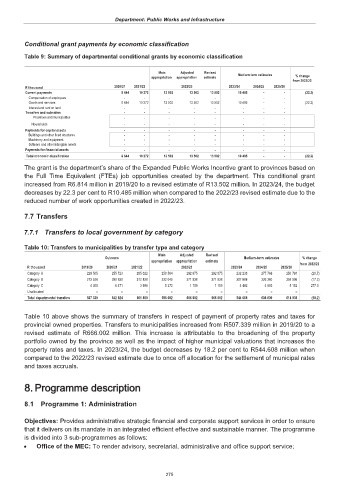
Table 9: Summary of departmental conditional grants by economic classification
Main Adjusted Revised
appropriation appropriation estimate Medium-term estimates % change
from 2022/23
R thousand 2020/21 2021/22 2022/23 2023/24 2024/25 2025/26
Current payments 8 644 10 272 13 502 13 502 13 502 10 485 - - (22.3)
Compensation of employees - - - - - - - -
Goods and services 8 644 10 272 13 502 13 502 13 502 10 485 - - (22.3)
Interest and rent on land - - - - - - - -
Transfers and subsidies - - - - - - - -
Provinces and municipalities - - - - - - - -
Households - - - - - - - -
Payments for capital assets - - - - - - - -
Buildings and other fixed structures - - - - - - - -
Machinery and equipment - - - - - - - -
Software and other intangible assets - - - - - - - -
Payments for financial assets - - - - - - - -
Total economic classification 8 644 10 272 13 502 13 502 13 502 10 485 - - (22.3)
The grant is the department’s share of the Expanded Public Works Incentive grant to provinces based on
the Full Time Equivalent (FTEs) job opportunities created by the department. This conditional grant
increased from R6.814 million in 2019/20 to a revised estimate of R13.502 million. In 2023/24, the budget
decreases by 22.3 per cent to R10.485 million when compared to the 2022/23 revised estimate due to the
reduced number of work opportunities created in 2022/23.
7.7 Transfers
7.7.1 Transfers to local government by category
Table 10: Transfers to municipalities by transfer type and category
Main Adjusted Revised
Outcome Medium-term estimates % change
appropriation appropriation estimate
R thousand 2019/20 2020/21 2021/22 2022/23 2023/24 2024/25 2025/26 from 2022/23
Category A 229 505 255 723 285 022 258 584 292 875 292 875 232 238 277 766 250 791 (20.7)
Category B 273 526 280 630 312 838 332 045 371 938 371 938 307 888 326 360 358 996 (17.2)
Category C 4 308 6 471 3 999 5 373 1 189 1 189 4 482 4 683 5 152 277.0
Unallocated – – – – – – – – –
Total departmental transfers 507 339 542 824 601 859 596 002 666 002 666 002 544 608 608 809 614 939 (18.2)
Table 10 above shows the summary of transfers in respect of payment of property rates and taxes for
provincial owned properties. Transfers to municipalities increased from R507.339 million in 2019/20 to a
revised estimate of R666.002 million. This increase is attributable to the broadening of the property
portfolio owned by the province as well as the impact of higher municipal valuations that increases the
property rates and taxes. In 2023/24, the budget decreases by 18.2 per cent to R544.608 million when
compared to the 2022/23 revised estimate due to once off allocation for the settlement of municipal rates
and taxes accruals.
8. 8. Programme description
8.1 Programme 1: Administration
Objectives: Provides administrative strategic financial and corporate support services in order to ensure
that it delivers on its mandate in an integrated efficient effective and sustainable manner. The programme
is divided into 3 sub-programmes as follows:
x Office of the MEC: To render advisory, secretarial, administrative and office support service;
275