Page 290 - Provincial Treasury Estimates.pdf
P. 290

Department: Public Works and Infrastructure
           Payments for Capital Assets decreased  from  R254.932 million in 2019/20 to a revised estimate of
           R210.937 million in 2022/23. The decrease is as a result of the once off allocations for acquiring and
           building of properties over the years.  In 2023/24, the budget increases by 15.6 per cent  to
           R243.806 million when compared to the 2022/23 revised estimate due to the department’s focus on the
           district development through office complexes.


           7.4  Expenditure by municipal boundary
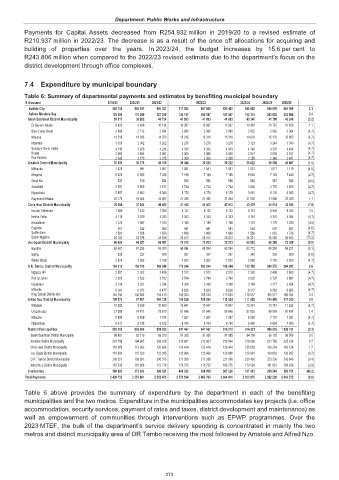
           Table 6: Summary of departmental payments and estimates by benefiting municipal boundary
            R thousand                   2019/20  2020/21  2021/22      2022/23        2023/24  2024/25  2025/26
             Buffalo City                          585 708             566 197             604 027             617 925             657 925             635 425             649 082             656 970       664 509  2.1
             Nelson Mandela Bay           123 399  119 289  127 259  130 187  180 187  187 687  192 110  203 932  213 986  2.4
            Sarah Baartman District Municipality                39 517               38 202               40 754               41 693               41 693               41 693               40 346               41 790        43 248  (3.2)
              Dr Beyers Naude                         9 826                9 499               10 134               10 367               10 367               10 367               10 483               10 767        10 829  1.1
              Blue Crane Route                        2 806                2 712                2 894                2 960                2 960                2 960                2 822                2 932          3 064  (4.7)
              Makana                                 14 519               14 036               14 973               15 318               15 318               15 318               14 603               15 170        15 853  (4.7)
              Ndlambe                                 3 105                3 002                3 202                3 276                3 276                3 276                3 123                3 244          3 390  (4.7)
              Sundays River Valley         4 116   3 979   4 245   4 343  4 343   4 343   4 140   4 301  4 494  (4.7)
              Kouga                        2 900   2 804   2 991   3 060  3 060   3 060   2 917   3 030  3 167  (4.7)
              Kou-Kamma                    2 245   2 170   2 315   2 369  2 369   2 369   2 258   2 346  2 451  (4.7)
            Amatole District Municipality                37 009               35 776               38 166               39 044               39 223               39 222               38 622               39 568        40 407  (1.5)
              Mbhashe                                 1 025                   991                1 057                1 081                1 081                1 081                1 031                1 071          1 119  (4.6)
              Mnquma                                  6 823                6 595                7 036                7 198                7 198                7 198                6 862                7 129          7 449  (4.7)
              Great Kei                                  537                   519                   554                   566                   566                   566                   540                   561             586  (4.6)
              Amahlathi                               2 591                2 505                2 672                2 734                2 734                2 734                2 606                2 707          2 829  (4.7)
              Ngqushwa                                5 857                5 662                6 040                6 179                6 179                6 179                5 891                6 120          6 395  (4.7)
              Raymond Mhlaba                         20 176               19 504               20 807               21 286               21 465               21 464               21 692               21 980        22 029  1.1
             Chris Hani District Municipality                39 254               37 944               40 480               41 412               41 412               43 912               40 479               41 914        43 658  (7.8)
              Inxuba Yethemba                         7 699                7 442                7 939                8 122                8 122                8 122                8 743                8 944          9 206  7.6
              Intsika Yethu                           4 116                3 979                4 245                4 343                4 343                4 343                4 140                4 301          4 494  (4.7)
              Emalahleni                              1 125                1 087                1 160                1 186                1 186                1 186                1 131                1 175          1 228  (4.6)
              Engcobo                       551     532     568    581     581     581     554    576   601    (4.6)
              Sakhisizwe                   1 581   1 528   1 630   1 668  1 668   1 668   1 590   1 652  1 726  (4.7)
              Enoch Mgijima                24 182  23 376  24 938  25 512  25 512  28 012  24 321  25 266  26 403  (13.2)
            Joe Gqabi District Municipality                66 420               64 207               68 497               70 073               70 073               72 573               66 802               69 398        72 520  (8.0)
              Elundini                               63 407               61 295               65 390               66 894               66 894               69 394               63 772               66 250        69 231  (8.1)
              Senqu                                      338                   327                   349                   357                   357                   357                   340                   353             369  (4.8)
              Walter Sisulu                           2 675                2 585                2 758                2 822                2 822                2 822                2 690                2 795          2 920  (4.7)
            O.R. Tambo District Municipality              164 212             158 742             169 348             173 244             183 244             188 244             193 158             200 575       204 297  2.6
              Ngquza Hill                             2 381                2 302                2 456                2 512                2 512                2 512                2 395                2 488          2 600  (4.7)
              Port St Johns                           2 620                2 533                2 702                2 764                2 764                2 764                2 635                2 737          2 861  (4.7)
              Nyandeni                                3 136                3 031                3 234                3 308                3 308                3 308                3 154                3 277          3 424  (4.7)
              Mhlontlo                     6 281   6 072   6 477   6 626  6 626   6 626   6 317   6 562  6 858  (4.7)
              King Sabata Dalindyebo      149 794  144 804  154 479  158 034  168 034  173 034  178 657  185 511  188 554  3.2
            Alfred Nzo District Municipality              100 970               97 607             104 129             106 524             106 524             111 524             111 552             114 498       117 245  0.0
              Matatiele                              10 282                9 939               10 603               10 847               10 847               10 847               10 341               10 743        11 226  (4.7)
              Umzimvubu                              77 389               74 811               79 810               81 646               81 646               86 646               87 835               89 859        91 498  1.4
              Mbizana                                 6 888                6 659                7 104                7 267                7 267                7 267                6 928                7 197          7 521  (4.7)
              Ntabankulu                              6 411                6 198                6 612                6 764                6 764                6 764                6 448                6 699          7 000  (4.7)
            District Municipalities                892 380             862 654             920 292             941 467             947 467             976 910             974 321             995 033    1 039 751  (0.3)
             Sarah Baartman District Municipality                86 601               83 716               89 310               91 365               91 365               91 365               94 100               96 125        98 556  3.0
             Amatole District Municipality              201 706             194 987             208 015             212 801             212 801             218 244             219 668             221 750       235 234  0.7
             Chris Hani District Municipality              116 979             113 082             120 638             123 414             123 414             128 414             130 653             138 224       142 124  1.7
             Joe Gqabi District Municipality              119 304             115 330             123 035             125 866             125 866             130 866             129 991             134 653       136 262  (0.7)
             O.R. Tambo District Municipality              200 251             193 581             206 515             211 266             217 266             221 266             220 405             223 230       242 646  (0.4)
             Alfred Nzo District Municipality              167 539             161 958             172 779             176 755             176 755             186 755             179 504             181 051       184 929  (3.9)
            Unallocated                            380 883             373 243             399 521             409 025             396 015             367 226             197 403             218 548       203 751  (46.2)
            Total Payments                      2 429 752          2 353 861          2 512 473          2 570 594          2 663 763          2 664 416          2 503 875          2 582 226    2 643 372  (6.0)

           Table 6 above  provides the summary of expenditure by the department in each of the benefiting
           municipalities and the two metros. Expenditure in the municipalities accommodates key projects (i.e. office
           accommodation, security services, payment of rates and taxes, district development and maintenance) as
           well as empowerment  of communities  through interventions such as  EPWP programmes.  Over  the
           2023 MTEF, the bulk of the department’s service delivery spending is concentrated in mainly the two
           metros and district municipality area of OR Tambo receiving the most followed by Amatole and Alfred Nzo.


                                                             273
   285   286   287   288   289   290   291   292   293   294   295