
Page 289 - Provincial Treasury Estimates.pdf
P. 289
Estimates of the Provincial Revenue and Expenditure (EPRE) – 2023/24 Financial Year
7.3 Summary of economic classification
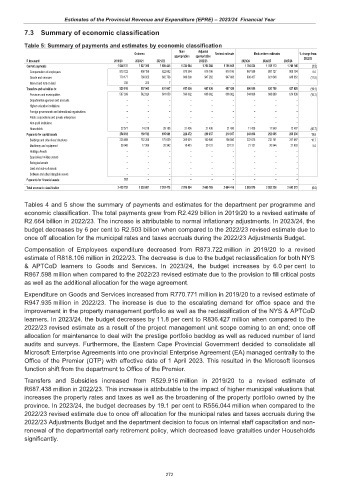
Table 5: Summary of payments and estimates by economic classification
Main Adjusted
Outcome Revised estimate Medium-term estimates % change from
appropriation appropriation
R thousand 2019/20 2020/21 2021/22 2022/23 2023/24 2024/25 2025/26 2022/23
Current payments 1 644 137 1 627 306 1 685 445 1 724 684 1 765 388 1 766 041 1 704 025 1 708 773 1 746 746 (3.5)
Compensation of employees 873 722 858 156 822 682 875 384 818 106 818 106 867 598 887 127 900 194 6.0
Goods and services 770 177 768 925 862 756 849 300 947 282 947 935 836 427 821 646 846 552 (11.8)
Interest and rent on land 238 225 7 – – – – – –
Transfers and subsidies to: 529 916 557 043 631 047 617 438 687 438 687 438 556 044 620 758 627 426 (19.1)
Provinces and municipalities 507 339 542 824 601 859 596 002 666 002 666 002 544 608 608 809 614 939 (18.2)
Departmental agencies and accounts – – – – – – – – –
Higher education institutions – – – – – – – – –
Foreign governments and international organisations – – – – – – – – –
Public corporations and private enterprises – – – – – – – – –
Non-profit institutions – – – – – – – – –
Households 22 577 14 219 29 188 21 436 21 436 21 436 11 436 11 949 12 487 (46.7)
Payments for capital assets 254 932 169 512 195 981 228 472 210 937 210 937 243 806 252 695 269 200 15.6
Buildings and other fixed structures 225 889 152 206 175 639 209 991 190 806 190 806 222 675 232 151 247 597 16.7
Machinery and equipment 29 043 17 306 20 342 18 481 20 131 20 131 21 131 20 544 21 603 5.0
Heritage Assets – – – – – – – – –
Specialised military assets – – – – – – – – –
Biological assets – – – – – – – – –
Land and sub-soil assets – – – – – – – – –
Software and other intangible assets – – – – – – – – –
Payments for financial assets 767 – – – – – – – –
Total economic classification 2 429 752 2 353 861 2 512 473 2 570 594 2 663 763 2 664 416 2 503 875 2 582 226 2 643 372 (6.0)
Tables 4 and 5 show the summary of payments and estimates for the department per programme and
economic classification. The total payments grew from R2.429 billion in 2019/20 to a revised estimate of
R2.664 billion in 2022/23. The increase is attributable to normal inflationary adjustments. In 2023/24, the
budget decreases by 6 per cent to R2.503 billion when compared to the 2022/23 revised estimate due to
once off allocation for the municipal rates and taxes accruals during the 2022/23 Adjustments Budget.
Compensation of Employees expenditure decreased from R873.722 million in 2019/20 to a revised
estimate of R818.106 million in 2022/23. The decrease is due to the budget reclassification for both NYS
& APTCoD learners to Goods and Services. In 2023/24, the budget increases by 6.0 per cent to
R867.598 million when compared to the 2022/23 revised estimate due to the provision to fill critical posts
as well as the additional allocation for the wage agreement.
Expenditure on Goods and Services increased from R770.771 million in 2019/20 to a revised estimate of
R947.935 million in 2022/23. The increase is due to the escalating demand for office space and the
improvement in the property management portfolio as well as the reclassification of the NYS & APTCoD
learners. In 2023/24, the budget decreases by 11.8 per cent to R836.427 million when compared to the
2022/23 revised estimate as a result of the project management unit scope coming to an end; once off
allocation for maintenance to deal with the prestige portfolio backlog as well as reduced number of land
audits and surveys. Furthermore, the Eastern Cape Provincial Government decided to consolidate all
Microsoft Enterprise Agreements into one provincial Enterprise Agreement (EA) managed centrally to the
Office of the Premier (OTP) with effective date of 1 April 2023. This resulted in the Microsoft licenses
function shift from the department to Office of the Premier.
Transfers and Subsidies increased from R529.916 million in 2019/20 to a revised estimate of
R687.438 million in 2022/23. This increase is attributable to the impact of higher municipal valuations that
increases the property rates and taxes as well as the broadening of the property portfolio owned by the
province. In 2023/24, the budget decreases by 19.1 per cent to R556.044 million when compared to the
2022/23 revised estimate due to once off allocation for the municipal rates and taxes accruals during the
2022/23 Adjustments Budget and the department decision to focus on internal staff capacitation and non-
renewal of the departmental early retirement policy, which decreased leave gratuities under Households
significantly.
272