
Page 293 - Provincial Treasury Estimates.pdf
P. 293
Estimates of the Provincial Revenue and Expenditure (EPRE) – 2023/24 Financial Year
x Management of the Department: Overall management and support of the department; and
x Corporate Support: Manages personnel, procurement, finance administration and related support
services.
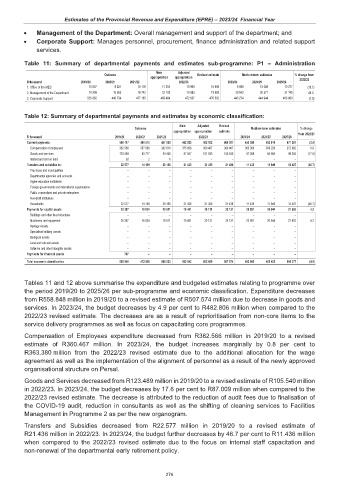
Table 11: Summary of departmental payments and estimates sub-programme: P1 – Administration
Main Adjusted
Outcome Revised estimate Medium-term estimates % change from
appropriation appropriation
R thousand 2019/20 2020/21 2021/22 2022/23 2023/24 2024/25 2025/26 2022/23
1. Office of the MEC 10 807 9 821 10 116 11 255 10 999 10 999 9 889 10 088 10 277 (10.1)
2. Management of the Department 18 959 15 953 18 742 22 103 19 983 19 983 29 643 30 371 31 140 48.3
3. Corporate Support 526 082 446 734 477 165 469 484 472 687 476 592 443 274 444 944 463 960 (7.0)
Table 12: Summary of departmental payments and estimates by economic classification:
Main Adjusted Revised
Outcome Medium-term estimates % change
appropriation appropriation estimate from 2022/23
R thousand 2019/20 2020/21 2021/22 2022/23 2023/24 2024/25 2025/26
Current payments 506 117 441 575 457 024 462 925 462 102 466 007 450 389 452 910 471 287 (3.4)
Compensation of employees 382 566 357 856 362 610 375 868 360 467 360 467 363 380 368 226 372 982 0.8
Goods and services 123 489 83 717 94 408 87 057 101 635 105 540 87 009 84 684 98 305 (17.6)
Interest and rent on land 62 2 6 – – – – – –
Transfers and subsidies to: 22 577 14 109 29 188 21 436 21 436 21 436 11 436 11 949 12 487 (46.7)
Provinces and municipalities – – – – – – – – –
Departmental agencies and accounts – – – – – – – – –
Higher education institutions – – – – – – – – –
Foreign governments and international organisations – – – – – – – – –
Public corporations and private enterprises – – – – – – – – –
Non-profit institutions – – – – – – – – –
Households 22 577 14 109 29 188 21 436 21 436 21 436 11 436 11 949 12 487 (46.7)
Payments for capital assets 26 387 16 824 19 811 18 481 20 131 20 131 20 981 20 544 21 603 4.2
Buildings and other fixed structures – – – – – – – – –
Machinery and equipment 26 387 16 824 19 811 18 481 20 131 20 131 20 981 20 544 21 603 4.2
Heritage Assets – – – – – – – – –
Specialised military assets – – – – – – – – –
Biological assets – – – – – – – – –
Land and sub-soil assets – – – – – – – – –
Software and other intangible assets – – – – – – – – –
Payments for financial assets 767 – – – – – – – –
Total economic classification 555 848 472 508 506 023 502 842 503 669 507 574 482 806 485 403 505 377 (4.9)
Tables 11 and 12 above summarise the expenditure and budgeted estimates relating to programme over
the period 2019/20 to 2025/26 per sub-programme and economic classification. Expenditure decreases
from R558.848 million in 2019/20 to a revised estimate of R507.574 million due to decrease in goods and
services. In 2023/24, the budget decreases by 4.9 per cent to R482.806 million when compared to the
2022/23 revised estimate. The decreases are as a result of reprioritisation from non-core items to the
service delivery programmes as well as focus on capacitating core programmes.
Compensation of Employees expenditure decreased from R382.566 million in 2019/20 to a revised
estimate of R360.467 million. In 2023/24, the budget increases marginally by 0.8 per cent to
R363.380 million from the 2022/23 revised estimate due to the additional allocation for the wage
agreement as well as the implementation of the alignment of personnel as a result of the newly approved
organisational structure on Persal.
Goods and Services decreased from R123.489 million in 2019/20 to a revised estimate of R105.540 million
in 2022/23. In 2023/24, the budget decreases by 17.6 per cent to R87.009 million when compared to the
2022/23 revised estimate. The decrease is attributed to the reduction of audit fees due to finalisation of
the COVID-19 audit, reduction in consultants as well as the shifting of cleaning services to Facilities
Management in Programme 2 as per the new organogram.
Transfers and Subsidies decreased from R22.577 million in 2019/20 to a revised estimate of
R21.436 million in 2022/23. In 2023/24, the budget further decreases by 46.7 per cent to R11.436 million
when compared to the 2022/23 revised estimate due to the focus on internal staff capacitation and
non-renewal of the departmental early retirement policy.
276