
Page 297 - Provincial Treasury Estimates.pdf
P. 297
Estimates of the Provincial Revenue and Expenditure (EPRE) – 2023/24 Financial Year
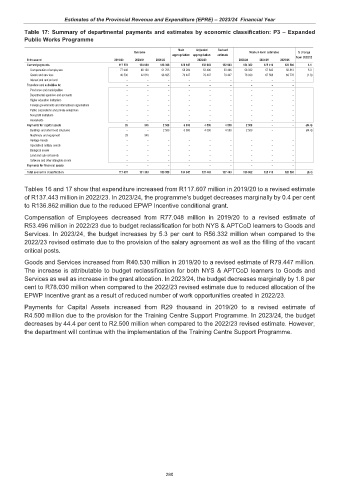
Table 17: Summary of departmental payments and estimates by economic classification: P3 – Expanded
Public Works Programme
Main Adjusted Revised
Outcome Medium-term estimates % change
appropriation appropriation estimate
R thousand 2019/20 2020/21 2021/22 2022/23 2023/24 2024/25 2025/26 from 2022/23
Current payments 117 578 130 960 148 398 128 647 132 943 132 943 134 362 125 410 128 590 1.1
Compensation of employees 77 048 88 150 51 703 58 200 53 496 53 496 56 332 57 842 58 812 5.3
Goods and services 40 530 42 810 96 695 70 447 79 447 79 447 78 030 67 568 69 778 (1.8)
Interest and rent on land – – – – – – – – –
Transfers and subsidies to: – – – – – – – – –
Provinces and municipalities – – – – – – – – –
Departmental agencies and accounts – – – – – – – – –
Higher education institutions – – – – – – – – –
Foreign governments and international organisations – – – – – – – – –
Public corporations and private enterprises – – – – – – – – –
Non-profit institutions – – – – – – – – –
Households – – – – – – – – –
Payments for capital assets 29 340 2 560 6 000 4 500 4 500 2 500 – – (44.4)
Buildings and other fixed structures – – 2 560 6 000 4 500 4 500 2 500 – – (44.4)
Machinery and equipment 29 340 – – – – – – –
Heritage Assets – – – – – – – – –
Specialised military assets – – – – – – – – –
Biological assets – – – – – – – – –
Land and sub-soil assets – – – – – – – – –
Software and other intangible assets – – – – – – – – –
Payments for financial assets – – – – – – – – –
Total economic classification 117 607 131 300 150 958 134 647 137 443 137 443 136 862 125 410 128 590 (0.4)
Tables 16 and 17 show that expenditure increased from R117.607 million in 2019/20 to a revised estimate
of R137.443 million in 2022/23. In 2023/24, the programme’s budget decreases marginally by 0.4 per cent
to R136.862 million due to the reduced EPWP Incentive conditional grant.
Compensation of Employees decreased from R77.048 million in 2019/20 to a revised estimate of
R53.496 million in 2022/23 due to budget reclassification for both NYS & APTCoD learners to Goods and
Services. In 2023/24, the budget increases by 5.3 per cent to R56.332 million when compared to the
2022/23 revised estimate due to the provision of the salary agreement as well as the filling of the vacant
critical posts.
Goods and Services increased from R40.530 million in 2019/20 to a revised estimate of R79.447 million.
The increase is attributable to budget reclassification for both NYS & APTCoD learners to Goods and
Services as well as increase in the grant allocation. In 2023/24, the budget decreases marginally by 1.8 per
cent to R78.030 million when compared to the 2022/23 revised estimate due to reduced allocation of the
EPWP Incentive grant as a result of reduced number of work opportunities created in 2022/23.
Payments for Capital Assets increased from R29 thousand in 2019/20 to a revised estimate of
R4.500 million due to the provision for the Training Centre Support Programme. In 2023/24, the budget
decreases by 44.4 per cent to R2.500 million when compared to the 2022/23 revised estimate. However,
the department will continue with the implementation of the Training Centre Support Programme.
280