
Page 295 - Provincial Treasury Estimates.pdf
P. 295
Estimates of the Provincial Revenue and Expenditure (EPRE) – 2023/24 Financial Year
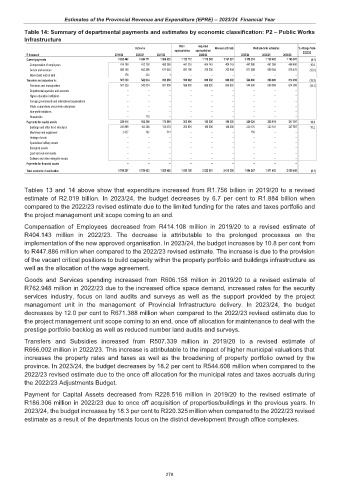
Table 14: Summary of departmental payments and estimates by economic classification: P2 – Public Works
Infrastructure
Main Adjusted
Outcome Revised estimate Medium-term estimates % change from
appropriation appropriation 2022/23
R thousand 2019/20 2020/21 2021/22 2022/23 2023/24 2024/25 2025/26
Current payments 1 020 442 1 054 771 1 080 023 1 133 112 1 170 343 1 167 091 1 119 274 1 130 453 1 146 870 (4.1)
Compensation of employees 414 108 412 150 408 369 441 316 404 143 404 143 447 886 461 059 468 400 10.8
Goods and services 606 158 642 398 671 653 691 796 766 200 762 948 671 388 669 394 678 470 (12.0)
Interest and rent on land 176 223 1 – – – – – –
Transfers and subsidies to: 507 339 542 934 601 859 596 002 666 002 666 002 544 608 608 809 614 939 (18.2)
Provinces and municipalities 507 339 542 824 601 859 596 002 666 002 666 002 544 608 608 809 614 939 (18.2)
Departmental agencies and accounts – – – – – – – – –
Higher education institutions – – – – – – – – –
Foreign governments and international organisations – – – – – – – – –
Public corporations and private enterprises – – – – – – – – –
Non-profit institutions – – – – – – – – –
Households – 110 – – – – – – –
Payments for capital assets 228 516 152 348 173 610 203 991 186 306 186 306 220 325 232 151 247 597 18.3
Buildings and other fixed structures 225 889 152 206 173 079 203 991 186 306 186 306 220 175 232 151 247 597 18.2
Machinery and equipment 2 627 142 531 – – – 150 – –
Heritage Assets – – – – – – – – –
Specialised military assets – – – – – – – – –
Biological assets – – – – – – – – –
Land and sub-soil assets – – – – – – – – –
Software and other intangible assets – – – – – – – – –
Payments for financial assets – – – – – – – – –
Total economic classification 1 756 297 1 750 053 1 855 492 1 933 105 2 022 651 2 019 399 1 884 207 1 971 413 2 009 406 (6.7)
Tables 13 and 14 above show that expenditure increased from R1.756 billion in 2019/20 to a revised
estimate of R2.019 billion. In 2023/24, the budget decreases by 6.7 per cent to R1.884 billion when
compared to the 2022/23 revised estimate due to the limited funding for the rates and taxes portfolio and
the project management unit scope coming to an end.
Compensation of Employees decreased from R414.108 million in 2019/20 to a revised estimate of
R404.143 million in 2022/23. The decrease is attributable to the prolonged processes on the
implementation of the new approved organisation. In 2023/24, the budget increases by 10.8 per cent from
to R447.886 million when compared to the 2022/23 revised estimate. The increase is due to the provision
of the vacant critical positions to build capacity within the property portfolio and buildings infrastructure as
well as the allocation of the wage agreement.
Goods and Services spending increased from R606.158 million in 2019/20 to a revised estimate of
R762.948 million in 2022/23 due to the increased office space demand, increased rates for the security
services industry, focus on land audits and surveys as well as the support provided by the project
management unit in the management of Provincial Infrastructure delivery. In 2023/24, the budget
decreases by 12.0 per cent to R671.388 million when compared to the 2022/23 revised estimate due to
the project management unit scope coming to an end, once off allocation for maintenance to deal with the
prestige portfolio backlog as well as reduced number land audits and surveys.
Transfers and Subsidies increased from R507.339 million in 2019/20 to a revised estimate of
R666.002 million in 2022/23. This increase is attributable to the impact of higher municipal valuations that
increases the property rates and taxes as well as the broadening of property portfolio owned by the
province. In 2023/24, the budget decreases by 18.2 per cent to R544.608 million when compared to the
2022/23 revised estimate due to the once off allocation for the municipal rates and taxes accruals during
the 2022/23 Adjustments Budget.
Payment for Capital Assets decreased from R228.516 million in 2019/20 to the revised estimate of
R186.306 million in 2022/23 due to once off acquisition of properties/buildings in the previous years. In
2023/24, the budget increases by 18.3 per cent to R220.325 million when compared to the 2022/23 revised
estimate as a result of the departments focus on the district development through office complexes.
278