
Page 302 - Provincial Treasury Estimates.pdf
P. 302
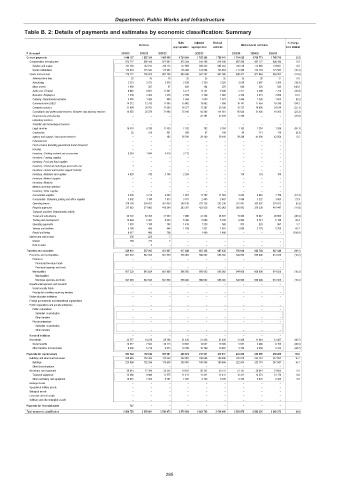
Department: Public Works and Infrastructure
Table B. 2: Details of payments and estimates by economic classification: Summary
Main Adjusted Revised % change
Outcome Medium-term estimates
appropriation appropriation estimate from 2022/23
R thousand 2019/20 2020/21 2021/22 2022/23 2023/24 2024/25 2025/26
Current payments 1 644 137 1 627 306 1 685 445 1 724 684 1 765 388 1 766 041 1 704 025 1 708 773 1 746 746 (3.5)
Compensation of employees 873 722 858 156 822 682 875 384 818 106 818 106 867 598 887 127 900 194 6.0
Salaries and wages 761 103 742 815 704 715 757 094 694 252 694 252 756 518 772 948 778 607 9.0
Social contributions 112 619 115 341 117 967 118 290 123 854 123 854 111 080 114 179 121 587 (10.3)
Goods and services 770 177 768 925 862 756 849 300 947 282 947 935 836 427 821 646 846 552 (11.8)
Administrative fees 32 35 16 25 25 25 25 26 27 0.0
Advertising 2 351 3 721 3 876 2 839 3 330 3 520 2 839 2 967 3 300 (19.3)
Minor assets 1 669 327 97 498 184 270 648 520 543 140.0
Audit cost: External 8 948 9 601 11 091 5 271 8 721 9 399 5 271 5 508 7 756 (43.9)
Bursaries: Employees 1 534 2 363 1 476 2 709 2 709 1 683 2 709 2 831 2 958 61.0
Catering: Departmental activities 3 086 1 424 999 1 644 1 639 1 573 1 444 1 526 1 603 (8.2)
Communication (G&S) 14 212 12 703 11 905 15 962 13 962 7 899 16 141 17 454 18 240 104.3
Computer services 21 084 20 761 17 055 16 277 17 397 20 195 15 727 18 900 24 614 (22.1)
Consultants and professional services: Business and advisory services 15 555 25 378 71 964 75 910 84 366 111 651 85 624 51 636 16 365 (23.3)
Infrastructure and planning – – – – 22 494 22 494 6 750 – – (70.0)
Laboratory services – – – – – – – – –
Scientific and technological services – – – – – – – – –
Legal services 16 470 6 230 11 433 1 152 152 3 304 1 152 1 204 1 258 (65.1)
Contractors 53 319 521 298 67 108 98 111 116 (9.3)
Agency and support / outsourced services – – 162 36 760 39 160 39 160 39 246 41 008 42 854 0.2
Entertainment – – – – – – – – –
Fleet services (including government motor transport) – – – – – – – – –
Housing – – – – – – – – –
Inventory: Clothing material and accessories 3 364 1 894 3 018 2 712 – – – – –
Inventory: Farming supplies – – – – – – – – –
Inventory: Food and food supplies – – – – – – – – –
Inventory: Chemicals,fuel,oil,gas,wood and coal 1 – – – – – – – –
Inventory: Learner and teacher support material – – – – – – – – –
Inventory: Materials and supplies 4 820 742 2 190 2 284 – – 119 124 130
Inventory: Medical supplies – – – – – – – – –
Inventory: Medicine – – – – – – – – –
Medsas inventory interface – – – – – – – – –
Inventory: Other supplies – – – – – – – – –
Consumable supplies 6 620 3 714 2 045 1 957 11 752 11 504 9 049 6 840 7 159 (21.3)
Consumable: Stationery,printing and office supplies 3 802 1 198 1 913 3 011 2 485 2 467 3 056 3 327 3 685 23.9
Operating leases 279 139 239 827 261 653 280 128 273 128 252 238 251 501 263 037 274 872 (0.3)
Property payments 317 683 371 862 419 204 383 351 423 036 413 963 365 093 376 239 410 447 (11.8)
Transport provided: Departmental activity – – – – – – – – –
Travel and subsistence 45 722 62 354 31 933 7 965 31 224 36 637 19 469 18 947 20 805 (46.9)
Training and development 10 894 2 301 8 293 5 380 6 880 5 728 6 894 5 741 6 145 20.4
Operating payments 1 933 1 188 708 1 418 1 250 826 873 925 967 5.7
Venues and facilities 3 188 495 446 1 749 1 921 1 891 2 699 2 775 2 709 42.7
Rental and hiring 8 017 489 758 – 1 400 1 400 – – – (100.0)
Interest and rent on land 238 225 7 – – – – – –
Interest 238 223 7 – – – – – –
Rent on land – 2 – – – – – – –
Transfers and subsidies 529 916 557 043 631 047 617 438 687 438 687 438 556 044 620 758 627 426 (19.1)
Provinces and municipalities 507 339 542 824 601 859 596 002 666 002 666 002 544 608 608 809 614 939 (18.2)
Provinces – – – – – – – – –
Provincial Revenue Funds – – – – – – – – –
Provincial agencies and funds – – – – – – – – –
Municipalities 507 339 542 824 601 859 596 002 666 002 666 002 544 608 608 809 614 939 (18.2)
Municipalities – – – – – – – – –
Municipal agencies and funds 507 339 542 824 601 859 596 002 666 002 666 002 544 608 608 809 614 939 (18.2)
Departmental agencies and accounts – – – – – – – – –
Social security funds – – – – – – – – –
Provide list of entities receiving transfers – – – – – – – – –
Higher education institutions – – – – – – – – –
Foreign governments and international organisations – – – – – – – – –
Public corporations and private enterprises – – – – – – – – –
Public corporations – – – – – – – – –
Subsidies on production – – – – – – – – –
Other transfers – – – – – – – – –
Private enterprises – – – – – – – – –
Subsidies on production – – – – – – – – –
Other transfers – – – – – – – – –
Non-profit institutions – – – – – – – – –
Households 22 577 14 219 29 188 21 436 21 436 21 436 11 436 11 949 12 487 (46.7)
Social benefits 13 577 7 503 20 115 10 637 10 637 10 949 5 637 5 890 6 155 (48.5)
Other transfers to households 9 000 6 716 9 073 10 799 10 799 10 487 5 799 6 059 6 332 (44.7)
Payments for capital assets 254 932 169 512 195 981 228 472 210 937 210 937 243 806 252 695 269 200 15.6
Buildings and other fixed structures 225 889 152 206 175 639 209 991 190 806 190 806 222 675 232 151 247 597 16.7
Buildings 225 889 152 206 175 639 209 991 190 806 190 806 222 675 232 151 247 597 16.7
Other fixed structures – – – – – – – – –
Machinery and equipment 29 043 17 306 20 342 18 481 20 131 20 131 21 131 20 544 21 603 5.0
Transport equipment 12 068 9 984 11 575 11 411 11 411 11 411 12 411 12 474 13 170 8.8
Other machinery and equipment 16 975 7 322 8 767 7 070 8 720 8 720 8 720 8 070 8 433 0.0
Heritage Assets – – – – – – – – –
Specialised military assets – – – – – – – – –
Biological assets – – – – – – – – –
Land and sub-soil assets – – – – – – – – –
Software and other intangible assets – – – – – – – – –
Payments for financial assets 767 – – – – – – – –
Total economic classification 2 429 752 2 353 861 2 512 473 2 570 594 2 663 763 2 664 416 2 503 875 2 582 226 2 643 372 (6.0)
285